Behavior of Various Machine Learning Models in the Face of Noisy Data
Michael D. Blechner, M.D.
MIT HST.951 Final project
Fall 2005
Abstract
Although
a great deal of attention has been focused on the future potential for
molecular-based cancer diagnosis, histologic examination of tissue specimens
remains the mainstay of diagnosis. The process of histologic diagnosis entails
the identification of visual features from a slide, followed by the recognition
of a feature pattern to which the case belongs. The combination of image
analysis and machine learning imitates this process and in certain
circumstances may be able to aid the pathologist. However, there is a great
deal of variability and noise inherent in such an approach. Therefore, a
classification model developed from data at one institution is likely to
perform acceptably at other institutions, only if the model can handle such variability.
This paper compares the performance of machine learning models based on fuzzy
rules (FR), fuzzy decision trees (FDT), artificial neural networks (aNN) and
logistic regression (LR) and examines how these models behave in the face of
noisy and variant data. Results suggest that FDT models may be more resistant
to data noise.
Background
Although
a great deal of attention has been focused on the future potential of
molecular-based cancer identification, histologic examination of tissue
specimens remains the mainstay of diagnosis. The process of histologic
diagnosis entails the identification of visual features from a slide, followed
by the recognition of a feature pattern to which the case belongs. The pattern
is associated with a high or low probability of cancer. For example a
pathologist examining a breast biopsy may identify breast epithelial cells with
large, irregular shaped nuclei, irregularly clumped chromatin, growing in
poorly arranged sheets and showing invasion into the surrounding connective
tissue with an associated fibrotic reaction. These findings compose a pattern
that is highly correlated with malignancy and would warrant such a
diagnosis.
Imaging
equipment and image analysis software can partially, and perhaps eventually,
completely automate the process of feature extraction.1, 2 Given a
list of previously identified visual features for a large number of cases,
machine learning techniques can be used to discern patterns relevant to the
separation of cancer from benign. The process of discerning such patterns from
data results in a model of the domain. Diagnostic predictions can be made by
applying such models to the data generated from new cases.
Wolberg,
etal, demonstrated the correspondence between human histologic diagnosis and the
combined techniques of image analysis and machine learning using the cytologic
diagnosis of breast cancer for illustration.3 Breast cancer is the
most common cancer in women and the second leading cause of female cancer
deaths. Cancer screening involves mammography followed by tissue sampling and
histologic examination of any mammographically worrisome area. Tissue samples
are also obtained without mammography in the setting of palpable breast lumps.
Initial tissue sampling in either situation is typically by needle core biopsy
or fine needle aspiration (FNA). Core biopsy provides more tissue and retains
tissue architecture for evaluation, while FNA typically yields a smaller sample
and destroys or severely alters the tissue architecture. Although more invasive,
core biopsy is the initial tissue procurement technique of choice in most
situations. However, FNA is less invasive, can be performed in the physician’s
office at a moments notice, is less expensive and therefore is still widely
used. In addition, FNA is used more extensively for cancer diagnosis and
screening in many other organ systems.
The
histologic features used to diagnose breast cancer fall into 2 major
categories; architectural and cytologic. Architectural features include those
that describe how groups of cells relate to one another and to the surrounding
connective tissue. They include characteristics such as the presence or absence
of irregular, distorted or excessively cellular glands, too many glandular
structures and the presence of single epithelial cells invading into connective
tissue. By and large, these features cannot be reliably ascertained in FNA
specimens. Cytologic features describe characteristics of single cells and
include cell size, nuclear size, nuclear membrane irregularity and nuclear
chromatin distribution to name a few. The FNA diagnosis of breast cancer is
largely based on the nuclear cytologic features of increased nuclear size,
nuclear membrane irregularity and irregularity of chromatin distribution. These
features are relatively easily assessed by FNA.
Wolberg
and his colleagues examined 569 breast FNA specimens.3
Semi-automated image analysis techniques were applied to digital
photomicrographs taken from each case. The image analysis process identified
the nuclear outline of 10-20 human selected cells within each image. Provided a
rough estimate of the location of a cell nucleus, image analysis techniques
used variations in pixel values to automatically identify a nuclear contour.
For each nucleus, the nuclear outline and pixel values within the nucleus were
used to calculate the following 10 values; radius, texture, perimeter, area,
smoothness, compactness, concavity, concave points, symmetry, and fractal
dimension. These attributes are all representations of the 3 key attributes
mentioned above; nuclear size, nuclear membrane irregularity and irregularity
of chromatin distribution. The values from each of the 10-20 selected cells
were used to calculate the mean and standard error for each variable within
each case. In addition, the three worst or largest values within a case were
used to calculate a worst mean value for each attribute. The resulting data set
consists of 30 variables for 569 cases. A 31st variable is the class
assignment of benign or malignant, based on the pathologist’s final cytologic
diagnosis which was confirmed in subsequent histologic examination of any
additional biopsies as well as clinical follow-up. The data set includes 212
cases of cancer and 357 cases of benign breast changes.
Wolberg
and his colleagues subsequently applied 2 supervised machine learning
algorithms to the data and then evaluated the diagnostic performance if these
models. The algorithms used were logistic regression and a decision tree
algorithm known as Multisurface Method-Tree (MSM-T). In order to avoid
over-fitting the training data, a stepwise approach was used to select 3 of the
30 variables, one to represent each of nuclear size, texture and shape. The
attributes worst area, worst smoothness and mean texture demonstrated a
classification accuracy of 96.2% using logistic regression and 97.5% using
MSM-T. Both results represent averages from 10-fold cross validation.
Although
their purpose was not to develop an actual diagnostic technique for laboratory
use, the general idea of combining image analysis and machine learning can be
used for the automation of visual classification tasks in medicine. However,
there is a great deal of variability and noise inherent in such an approach.
The optical components of imaging equipment would likely vary from one
laboratory to another, resulting in variability in image capture that could
alter the results of feature extraction. Different image analysis software
would likely add additional variability. Even if, the imaging equipment and
software were standardized, differences in tissue processing from one lab to
the next would result in significant variability. For example, the use of
different varieties and concentrations of tissue fixatives, as well as
variations in fixation times, can significantly alter nuclear size and staining
of chromatin., In addition, the biological variability, even within cancer of a
single tissue type like breast epithelium, generates a great deal of
variability in the histologic features. Therefore, a prediction model developed
from data at one institution is likely to perform acceptably at other
institutions, only if the model can handle this variability.
Fuzzy
logic is an extension of Boolean logic that replaces binary truth values with
degrees of truth. It was introduced in
1965 by Prof. Lotfi Zadeh at the
This
paper compares the performance of machine learning models based on fuzzy rules
(FR), fuzzy decision trees (FDT), artificial neural networks (aNN) and logistic
regression (LR). The study hypothesizes that fuzzy-logic-based modeling
approaches will exhibit significantly more stable classification performance
with increasingly noisy test data. All models were built using an identical
training set and evaluated on an unaltered holdout test set as well as multiple
versions of the same test set distorted with noise to simulate variance from
image analysis and biologic variance.
Materials & Methods
Data set: The Wisconsin Diagnostic Breast Cancer (WDBC)
dataset was obtained from the UCI Machine learning repository.A The
dataset was created by Wolberg, Street
and Olvi and consists of data from 569 breast FNA cases containing 30
descriptive attributes and one binary classification variable (benign or
malignant). The descriptive attributes were obtained by semi-automated image
analysis applied to digital photomicrographs obtained from the FNA slides. The
case distribution includes 357 cases of benign breast changes and 212 cases of
malignant breast cancer. The descriptive attributes are recorded with four
significant digits and include the nuclear radius, texture, perimeter, area,
smoothness, compactness, concavity, concave points, symmetry, and fractal
dimension. The mean, standard deviation and mean of the worst 3 measurements
are recorded for each of these ten attributes for a total of 30 variables.
There are no missing attribute values.
Data pre-processing: The original dataset was divided into a training set
containing the first 380 cases and a test set consisting of the remaining 189
cases. Models were constructed and tested using both the full 30 variable data
set as well as a limited dataset consisting of only the 3 variables used in the
Wolberg models (worst area, worst smoothness and mean texture). Six additional
test sets were created by adding increasing amounts of noise to the original
test set data. The noise for each variable in each case was generated by
selecting at random from a normal distribution with a mean of zero and a
standard deviation of 0.001, 0.01, 0.1, 1, 10 and100 for each of the six
increasingly noisy data sets respectively. These six data sets attempted to
simulate a regular degree of noise that might be the result of variability from
image analysis and tissue processing. In the results and discussion, these test
datasets will be referred to as “noisy” test datasets. One additional test set
was generated by selecting at random from a normal distribution with a mean and
standard deviation equal to the mean and standard deviation for that attribute
within the specific case’s class brethren. This was an attempt to simulate the
natural biologic variability of these attributes within human cancers and
benign tissues. Since this process essentially randomly redistributes attribute
values from a pool within the class benign or malignant, this dataset will be
referred to as the “redistributed” dataset.
Software: All modeling and analysis was performed within R
version 2.2.0.B Additional packages and code used include the NNET
library available as part of Ripley’s VR bundle version 7.2-23C and
Vinterbo’s GCLD library, version 1.05c. The nrc() function for
building artificial neural networks using nnet() and the lrc() function for
building logistic regression models using the glm() function, were provided by
VinterboE.
Models: An FR model and an FDT model were built using the gcl and tcl
functions from the GCL package. 2x10-fold cross validation was used to select
an appropriate setting for the “nlev” parameter based on the highest mean
c-index with nlev set to 2 through 7. Final models were generated using an nlev
of 2 for both the 30-variable and 3-variable FR models. Values of 5 and 6 were
used for the 3 and 30-variable FDT models respectively. All other arguments to
gcl and tcl functions used the default values. Single hidden layer aNNs were
generated using the nrc function. 5x10-fold cross validation was used to select
an appropriate setting for the “nunits” parameter based on the highest mean c-index
with nunits set to 1 through 20. The nunits parameter determines the number of
units in the hidden layer. Two final aNN models were generated for each
training set (3 and 30-variables) using nunit values of 9 and 20. All other
arguments to the nrc function used the default values. A single LR model was
generated for each training dataset using the lrc function with the default glm
parameters.
Results
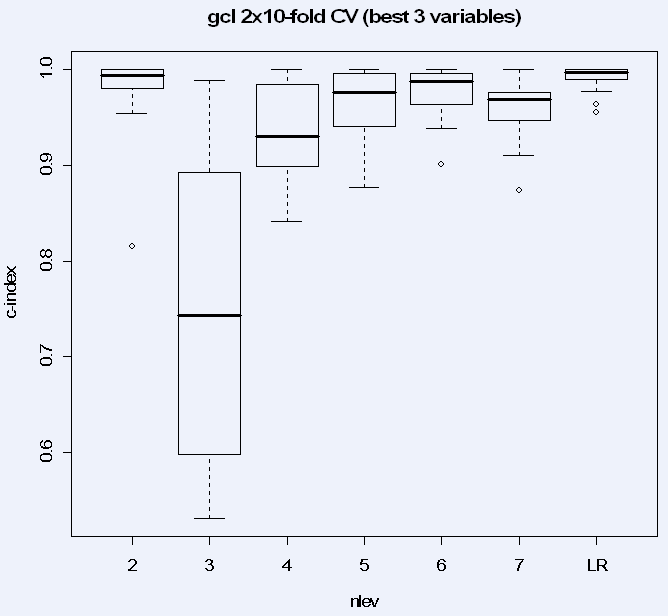
Parameter settings: The nlev parameter settings for the FR models were
compared using 2x10-fold CV on the training set for both the 3 and 30-variable
datasets. Values from 2 through 7 were examined. Figure 1 shows the results
for the 3-variable data. An nlev of 2 had the highest mean performance (0.979902)
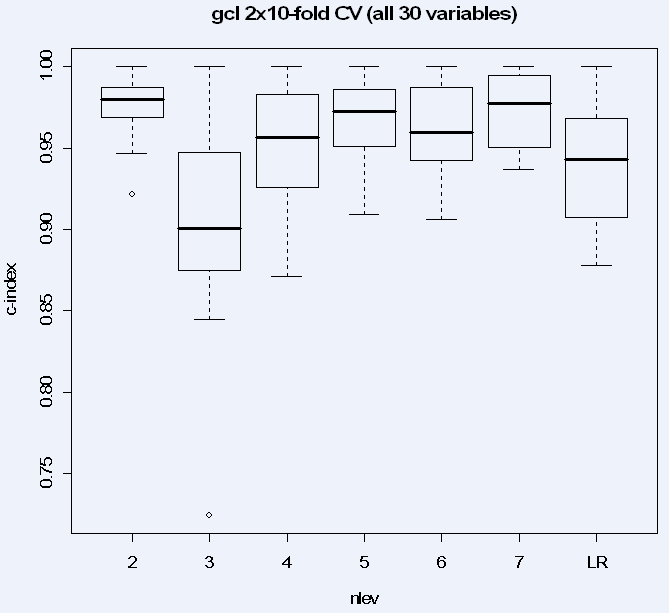
and this value was used for the final FR model construction. Figure 2 shows similar
results for the 30-variable dataset, with the highest mean performance
(0.9752503) for an nlev setting of 2. It is worth noting that although an nlev
of 2 results in the highest mean performance for both datasets, the difference
in performance compared to other nlev values is not statistically significant
for nlev of 5, 6, or 7 for either dataset (by paired t-test, p-value cutoff of
p = 0.05).
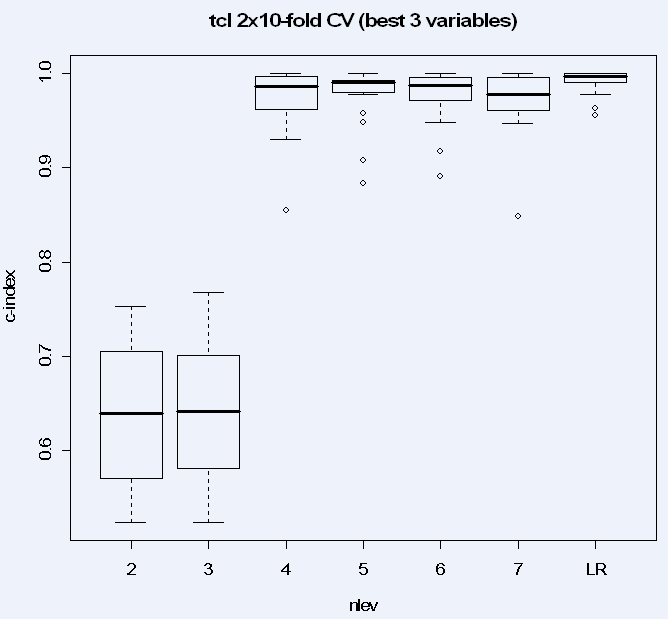
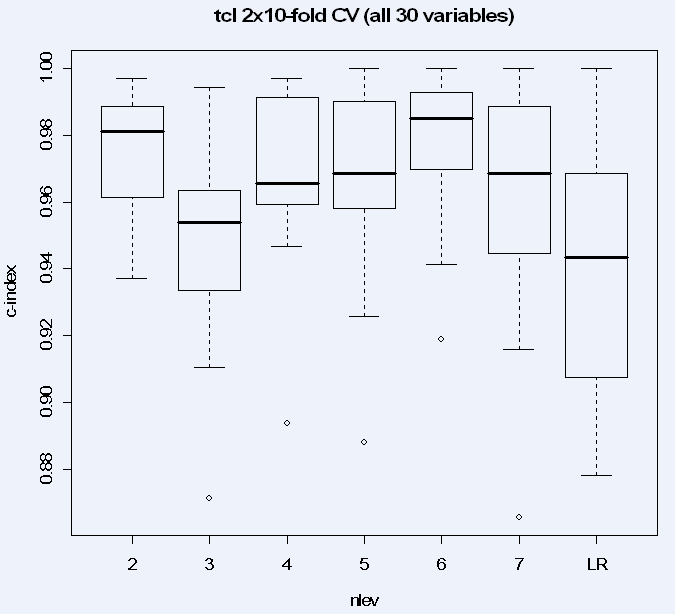
The
comparable results for the FDT models are shown in figures 3 and figure 4 with the highest
mean performance with an nlev of 5 (0.9779412) and 6 (0.9783514) for the 3 and
30-variable datasets respectively. Again, it is worth noting that although an
nlev of 5 and 6 result in the highest mean performance for the 2 datasets, the
difference in performance compared to other nlev values is not statistically
significant except when compared to an nlev of 2 or 3 for the 3-variable data
and an nlev of 3 for the full dataset.
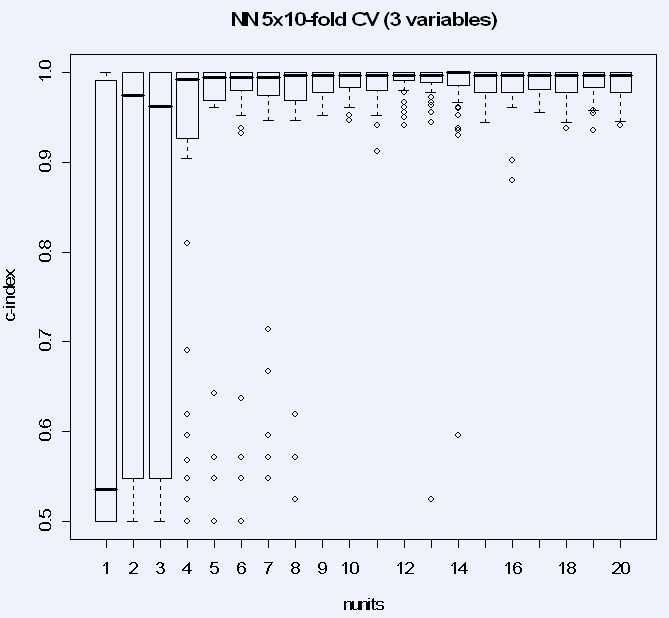
Results
of the 5x10-fold cross validation for aNN models are shown in figure 5 and figure 6. For reasons that
are not clear, aNN models showed wide variance in performance across different
folds, ranging from a c-index of near 0.5 up to 1.0 in many models. There is a
trend towards decreased variance with increased number of hidden units but this
does not hold across the board as witnessed by the poor performance in some
folds with 13 and 14 hidden units. This variance in performance was not
diminished by increasing the maximum number of weight adjustment iterations
from the default 100 up to 1000. An nunit setting of 9 was selected for both
the 3 and 30 variable data in order to strike a balance between maximizing
average performance, minimizing performance variance and minimizing hidden
units to avoid over-fitting. This was an ad hoc decision based largely on the
visual data presented in figures 5 and 6. For comparison, an additional aNN
model was generated for both datasets using an nunits setting of 20.
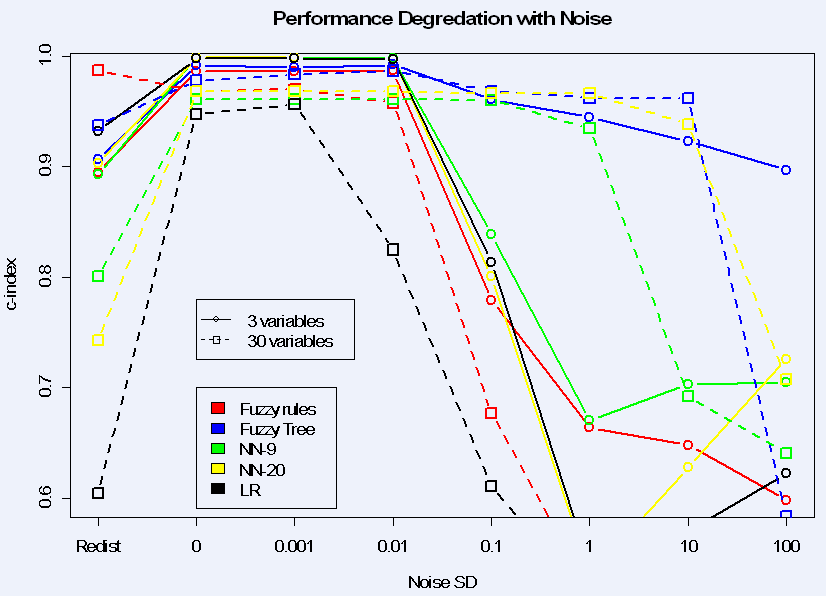
Final Model performance: The performance of each model (2 FR models, 2 FDT
models, 4 aNN models and 2 LR models) was evaluated by calculating the c-index
from the results of applying the model to the appropriate test set (3 or 30
variables). Performance deterioration was determined by calculating the c-index
from the results of applying the noisy datasets as well as the redistributed
dataset. The results are shown in table 1 and table 2 and Figure 7.
Discussion
Due
to the fuzzy nature of set membership in fuzzy logic approaches to modeling,
this study hypothesized that such machine learning algorithms would be more
resistant to noise in the data than other models. The study examined the
response to increasing levels of random noise generated from a normal
distribution around a mean of zero. This type of noise attempted to simulate
noise generated from the imaging process. The response to biologic variability
was examined by re-selecting each variable at random from a normal distribution
with a mean and SD equivalent to those for that variable within the
corresponding class (benign or malignant).
The
results of the cross validation studies for parameter selection reveal an
interesting trend. The variance in c-index values for the fuzzy algorithms
appears to be slightly less on average for the 30-variable data while the aNN
and LR models show distinctly lower variance with the 3-variable data. This
suggests the possibility that fuzzy models are more stable in the face of
excess variables.
In
relation to the nlev setting, one might expect that a very low nlev value would
not enable sufficient separation of the data while too large a value would
result in over-fitting. However, the data do not support this conclusion since
the FR model performed best with an nlev of 2 for both data sets and an nlev of
2 significantly outperformed a value of 3 in all cases except FDTs build from
the 3-variable data. A more detailed analysis of the effect of the nlev
parameter was beyond the scope of this study. The wide variance in performance
for the aNN model across numerous nunit settings remains a mystery. The nunit
parameter signifies the number of hidden units. Alterations to the maximum
number of weight adjustment iterations as well the decay rate did not alter
these results.
All
of the final models performed quite well on the original, unaltered test data
with a lowest c-index for the 30 variable LR model (0.947754). These results
are in agreement with Wolberg’s original results and conclusion that the data
are linearly separable. It is worth noting that all 5 3-variable models
outperformed the 30-variable models. This underscores the benefits of variable
selection for most situations. With increasing noise the first model to exhibit
a significant performance drop is the 30-variable LR model which is sensitive
to relatively low levels of noise and argues strongly for the variable
selection in LR. However, as the noise level continues to increase, the first
apparent trend is that the 3-variable models are more sensitive to noise, while
the 30-variable models retain respectable performance longer on average. The
aNN models based on a larger feature set appear to be significantly more
resistant to noise. At a noise of SD 10 units, both FDT models (3 and 30-variable)
as well as the 20 unit aNN retain reasonable performance. Surprisingly, even
with a noise SD of 100 units, the 3-variable FDT model performs with a c-index
approaching 0.9. In this analysis, FDTs appear to be most resistant to noisy
data and appear to gain no significant benefit from maintaining a larger
variable set.
This
data set is linearly separable using the 3 variables of worst area, worst
smoothness and mean texture. The mean for the 2nd parameter is 559 for benign
compared with 1422 for malignant cases. The respective standard deviations are
164 and 598. The other 2 parameters exhibit significant overlap between benign
and cancer populations. It appears that with the addition of noise of SD 100,
the FDT model is able to retain fairly good classification based on the wide
margin of separation that exists for this 2nd parameter.
Perhaps
the most interesting finding is the marked difference in response to noise
between FR and FDT models. The nlev parameter works identically for both models.
The FR models both used an nlev of 2 while the FDT models used values of 5 and
6. Follow-up analysis should examine the behavior of FR models with higher nlev
settings. However, conceptually, a higher nlev would be expected to over-fit
the training data and thus perform more poorly. This idea can be best
illustrated by imagining a very high nlev value that results in very narrow
fuzzy sets. In this scenario, each fuzzy set for a given variable contains only
one member (either a full or partial member) in the training data. As a result,
the fuzziness of these sets becomes irrelevant and the creation of rules or
decision tree boundaries is based on individual cases. Why the FDT models seem
to be so much more resistant to noise then the FR models is not clear and
requires more in depth analysis of the actual algorithms.
The
redistributed data attempts to simulate biologic variability. Arguably, the
true level of biologic variability is already represented in the training set.
The redistributed data could be considered to represent the extremes of such
variability and provide one assessment of performance in a worst case scenario.
It is worth noting that this approach of “redistributing” the data destroys any
co-dependencies between variables that may exist in the original data. With all
30 variables retained, the performance of both aNN models as well as the LR
model diminished markedly. Both fuzzy-based models, however, retained a c-index
of greater than 0.93. All five 3-variable models demonstrated similar
performance degradation compared to the unaltered test set, but retained
reasonably good performance with c-indices ranging from 0.89 to 0.93. The LR
model had the best performance. However, the maintained performance after data
redistribution is probably more a feature of the original linearly separable
data than the models.
It
is worth noting that in controlled situations where noise in the test data can
be kept to a minimum, these arguments do not apply and all of these models
perform equally well. The importance of these findings for real world
applications may also be insignificant if noise levels are below 0.01 assuming
any LR model also applies variable selection, as is typically the case.
Nonetheless, these results provide some insight into the behavior of these
models and can be used as a guide to further analyzing and understanding these
algorithms.
Conclusions
No
clear and convincing patterns emerge from the results. The hypothesis of
superior performance of fuzzy-based models in the face of noisy and
redistributed data is not supported. However, the FDT models do appear to be
more resistant to noise than the other models. Further study should focus on
this algorithm while examining other parameter settings and evaluating other
datasets, especially less linearly separable ones. Additional comparison with
support vector machine performance might also be useful since the SVM
algorithm’s ability to identify the separating plane with the largest margin
might also provide significant performance protection from noisy data. The gcl
and tcl functions use triangular fuzzy regions. Additional studies might
examine the effects of more complex fuzzy set boundaries. The results do
provide some insight into the behavior of these models and can be used as a guide
for further algorithm analysis.
References
Data & Software
1.
Data - http://www.ics.uci.edu/~mlearn/databases/breast-cancer-wisconsin/wdbc.data
2.
Documentation - http://www.ics.uci.edu/~mlearn/databases/breast-cancer-wisconsin/wdbc.names