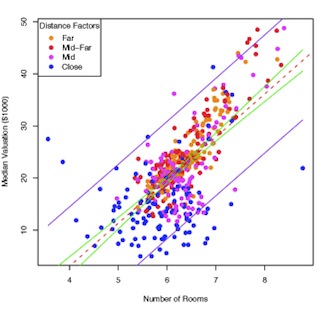
Scatterplot of home values in Boston
Description:
Scatterplot of Boston home data, showing the relationship between home values and the number of rooms in the home. (Image by Ezra Haber Glenn.)
file
30 kB
Scatterplot of home values in Boston
Alt text:
Scatterplot of home values in Boston.
Caption:
Scatterplot of Boston home data, showing the relationship between home values and the number of rooms in the home. (Image by Ezra Haber Glenn.)

Course Info
Instructor
Departments
As Taught In
Spring
2009
Level
Learning Resource Types
notes
Lecture Notes
grading
Exams
assignment
Written Assignments


