
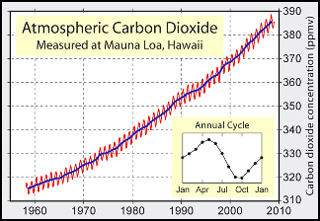
Graph showing atmospheric carbon dioxide levels for the years of 1960-2010
Description:
In this offering of 12.000, students are asked to propose an integrated global solution to the rapid rise in atmospheric CO2 levels. (Image created by Robert A. Rohde / Global Warming Art. Used with permission.)
file

30 kB
Graph showing atmospheric carbon dioxide levels for the years of 1960-2010
Alt text:
Graph showing atmospheric carbon dioxide levels for the years of 1960-2010.
Caption:
In this offering of 12.000, students are asked to propose an integrated global solution to the rapid rise in atmospheric CO2 levels. (Image created by Robert A. Rohde / Global Warming Art. Used with permission.)
Course Info
Instructor
Departments
As Taught In
Fall
2009
Level
Topics
Learning Resource Types
grading
Projects with Examples
assignment_turned_in
Written Assignments with Examples


