12-085s08.jpg
file
45 kB
12-085s08.jpg
Alt text:
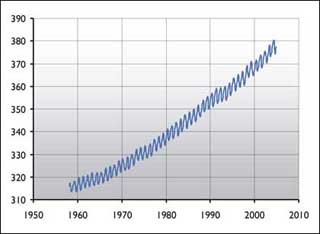
Graph of atmospheric carbon dioxide levels at Mauna Loa.
Caption:
Atmospheric CO₂ levels from 1958 to 2004 as measured at Mauna Loa. (Image courtesy of U.S. Department of Energy.)

Course Info
Instructor
Departments
As Taught In
Spring
2008
Level
Topics
Learning Resource Types
assignment_turned_in
Written Assignments with Examples


