12-340xs20.jpg
file
95 kB
12-340xs20.jpg
Alt text:
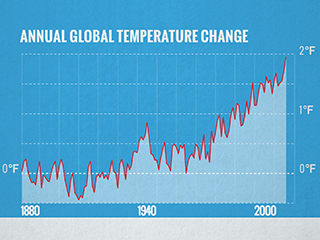
A plot of change in temperatures vs years.
Caption:
Graph of change in annual global temperatures, compared to the average of annual global temperatures from 1880 to 1999. (Public domain image courtesy of NASA’s Goddard Space Flight Center.)
Credit:
Image courtesy of NASA’s Goddard Space Flight Center.

Course Info
Instructors
Departments
As Taught In
Spring
2020
Level
Topics
Learning Resource Types
notes
Lecture Notes
theaters
Lecture Videos
assignment
Problem Sets
grading
Exams


