
The following demonstrations are graphic representations of concepts discussed in the lecture notes (PDF).
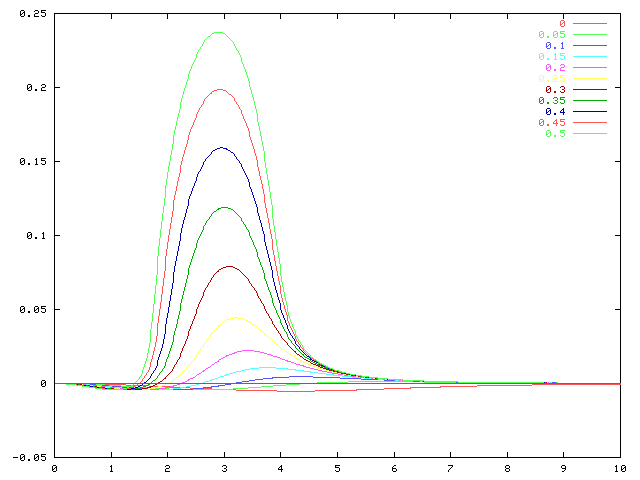
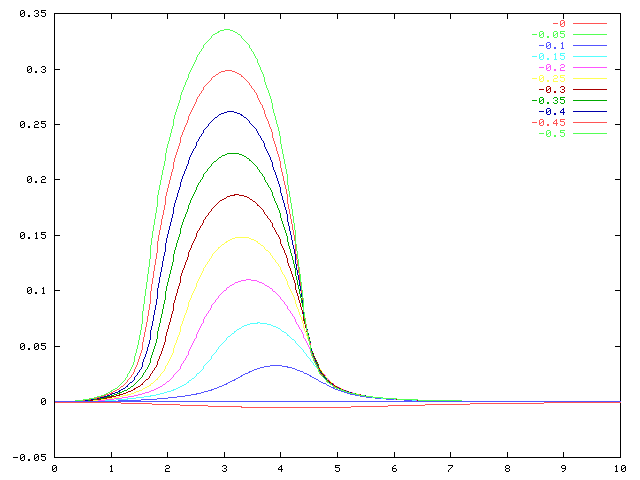
Page 2: Growth Rates
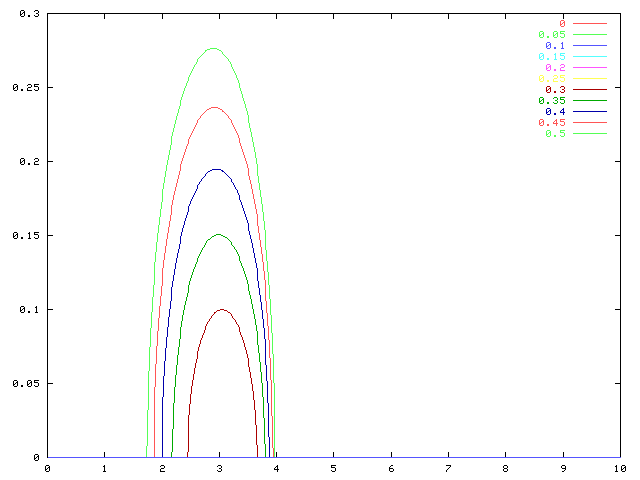
- r=0,u1 pos F2=4 (PNG)
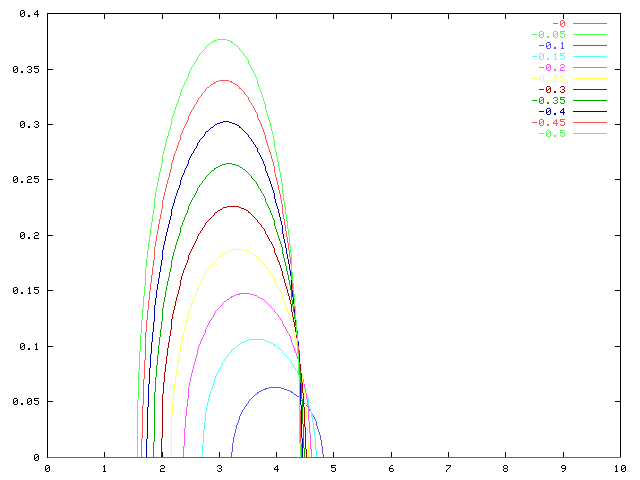
- r=0,u1 neg F1=20 (PNG)
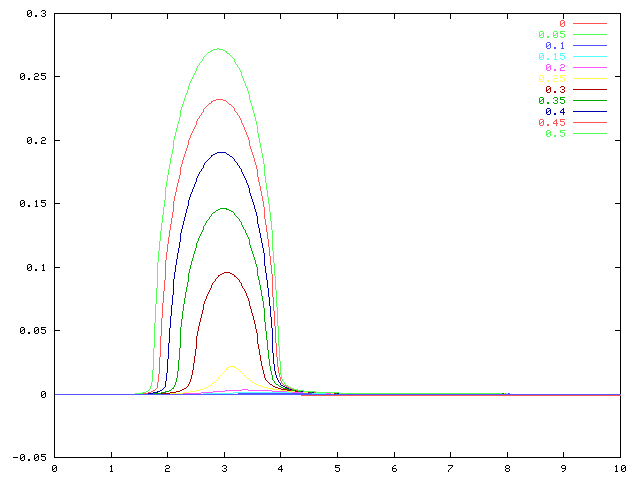
- r=0.01,u1 pos (PNG)
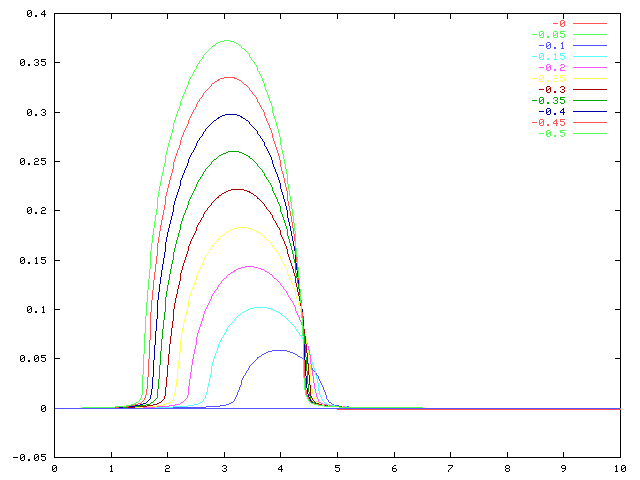
- r=0.01,u1 neg (PNG)
- r=0.1,u1 pos (PNG)
- r=0.1,u1 neg (PNG)
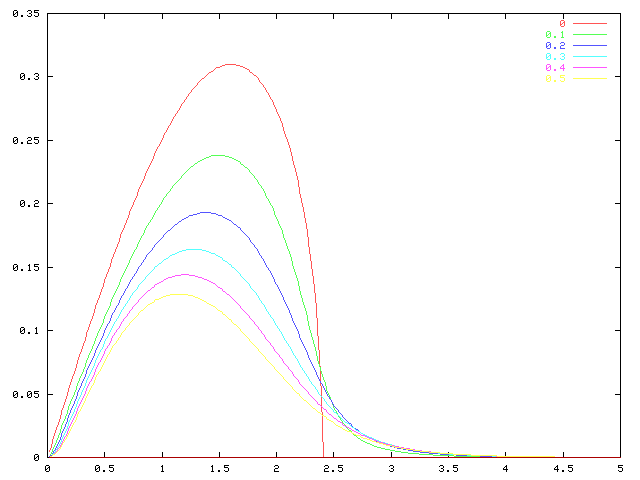
Page 2: Eady
- sigma vs r (PNG)
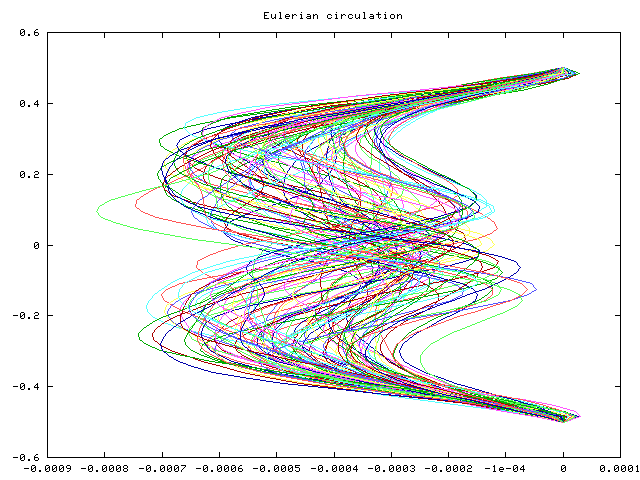
Page 2: Examples
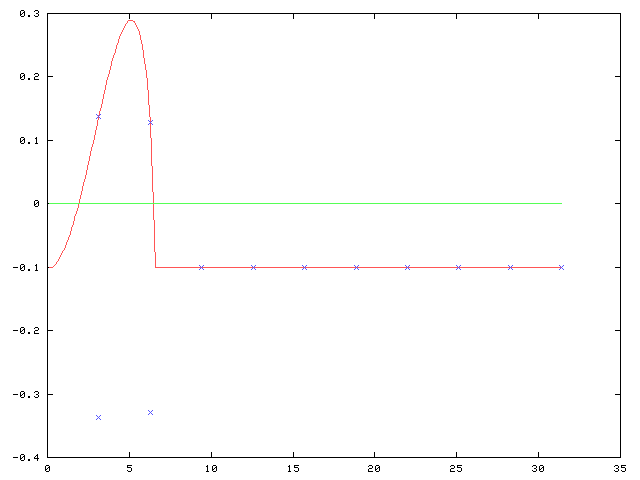
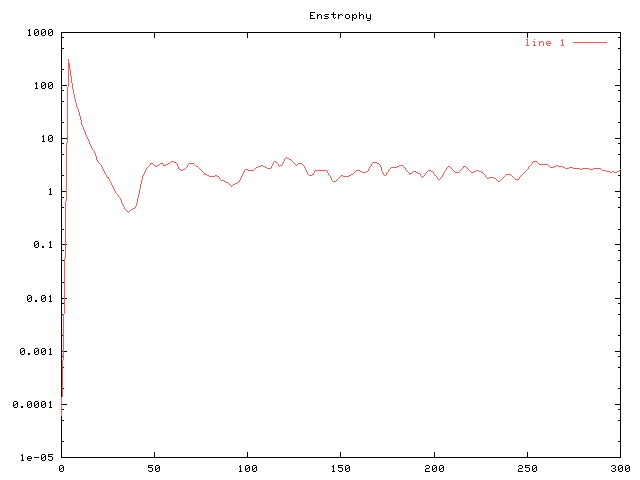
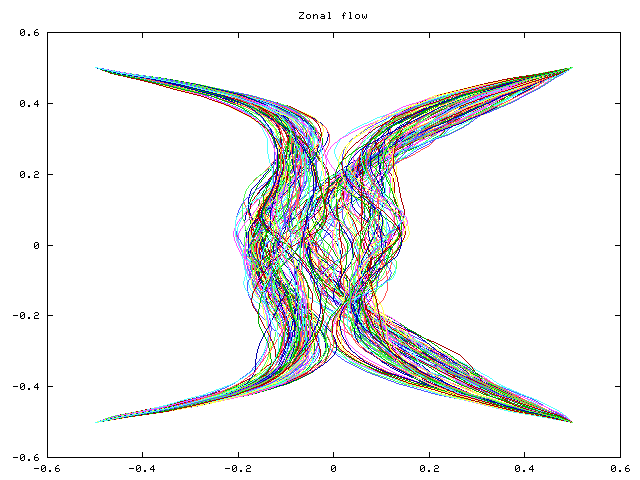
Page 3: Diagnostics
- Eddy enstrophy (PNG)
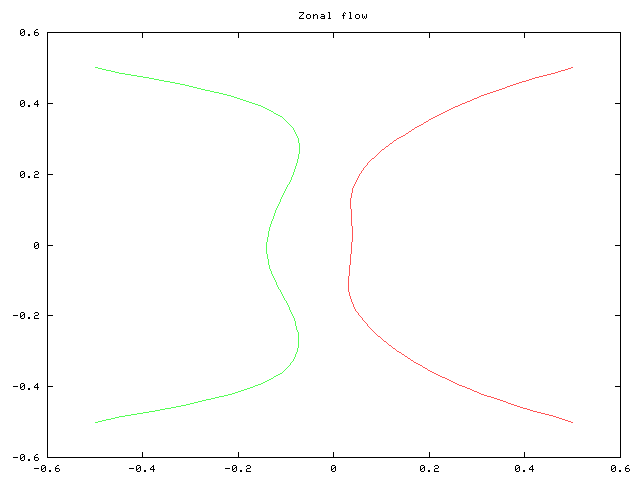
- Zonal flow (PNG)
- mean (PNG)
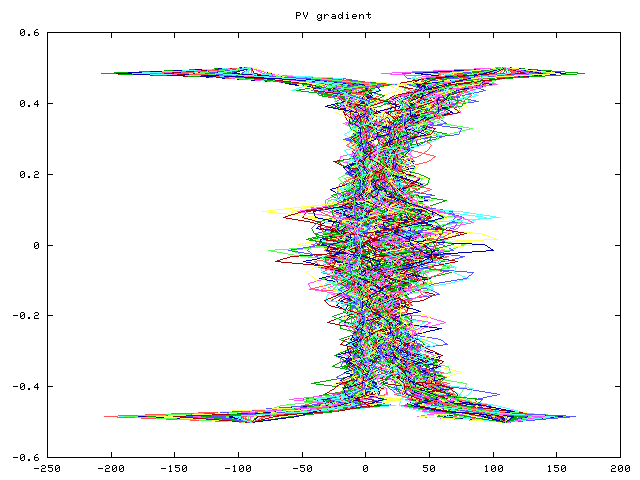
- PV gradients (PNG)
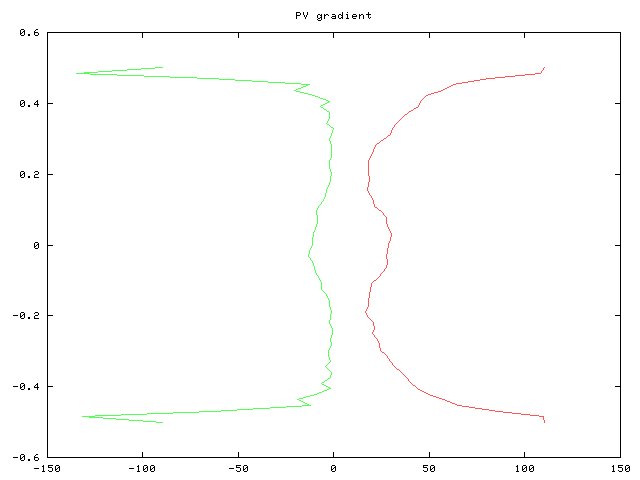
- mean PV gradients (PNG)
- phi (PNG)
- phia (PNG)
- mean (PNG)
Page 3: Triad
- no nonlinearity (PNG)
- nonlinear (PNG)
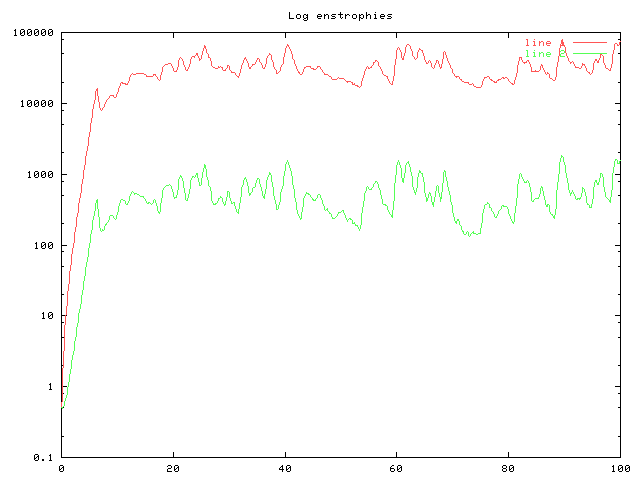
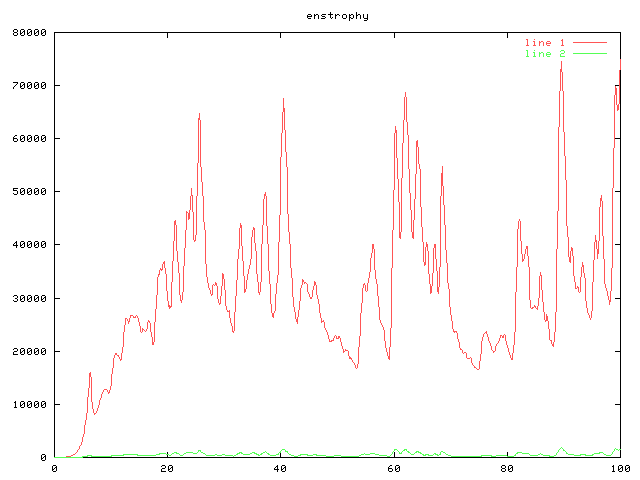
- full enstrophies (PNG)
- full enstrophies (PNG)
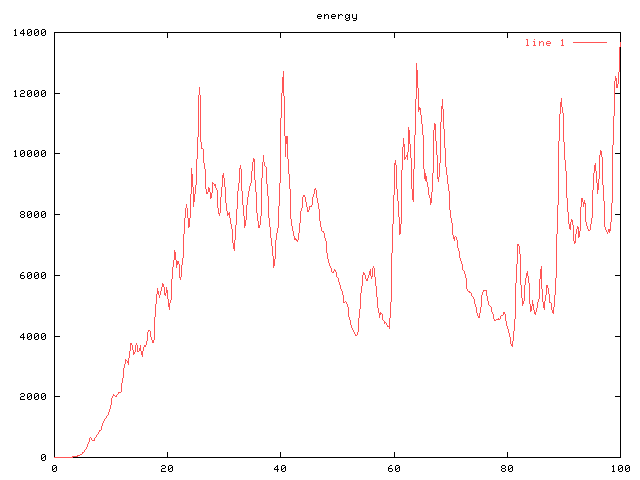
- full energy (PNG)
- zonal flow (JPG)
Page 7: Example
- Eddy enstrophy (PNG)


