
12-990s03.jpg
file
93 kB
12-990s03.jpg
Alt text:
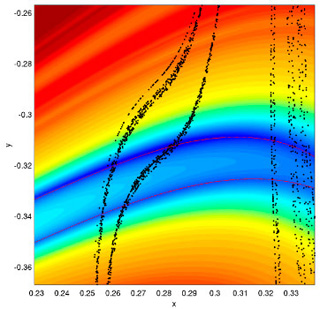
A double spectrum overlaid with scattered dots on a graph.
Caption:
Structure of the stable manifold for a two-dimensional, chaotic map. Black dots are points on the model attractor and red line is the local structure of the stable manifold - all points on the stable manifold collapse to the same point as they are integrated forward in time. The colors are a representation of the distance between a point in the space and a specified model trajectory. Note that the stable manifold lies in the minimum of this cost function space. (Courtesy of Prof. Jim Hansen.)
Course Info
Instructor
Departments
As Taught In
Spring
2003
Level
Topics
Learning Resource Types
assignment
Programming Assignments


