chp_merger_wave.jpg
Description:
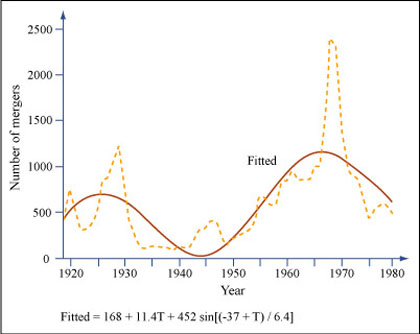
U. S. Mergers from 1919 to 1979. From 1919 to 1979, there were peaks and troughs in the number U. S. mergers. A sine wave with constants that have economic significance was fitted to the data. The figure shows that although there is a general wavelike trend in the actual data, the art of econometrics is necessary to create the simplicity and smoothness of the fitted equation. (Image by MIT OCW. Adapted from Figure 2 on page 496 of Golbe, Devra L., and Lawrence J. White. “Catch a Wave: The Time Series Behavior of Mergers.” Review of Economics and Statistics 75, no. 3 (August 1993): 493-499.)
file
37 kB
chp_merger_wave.jpg

Course Info
Learning Resource Types
assignment
Problem Sets


