Two pie charts, the left showing temperature increases from 3-4 to 6-8 degrees Celsius, and the right showing increases from 1-2 to 3-4 degrees
Description:
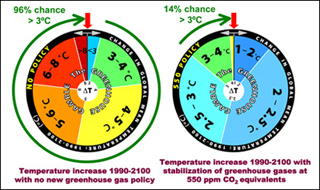
Comparison of likely temperature increases over 1990-2100 with no policy (left), and stabilization of greenhouse gases at 550pm CO2 equivalents (right). (Figure from the MIT Joint Program on the Science and Policy of Global Change.)
file
114 kB
Two pie charts, the left showing temperature increases from 3-4 to 6-8 degrees Celsius, and the right showing increases from 1-2 to 3-4 degrees
Alt text:
Two pie charts, the left showing temperature increases from 3-4 to 6-8 degrees Celsius, and the right showing increases from 1-2 to 3-4 degrees.
Caption:
Comparison of likely temperature increases over 1990-2100 with no policy (left), and stabilization of greenhouse gases at 550pm CO₂equivalents (right). (Figure from the MIT Joint Program on the Science and Policy of Global Change.)

Course Info
Departments
As Taught In
Spring
2008
Level
Topics
Learning Resource Types
assignment
Problem Sets
notes
Lecture Notes


