15-060f14.jpg
Description:
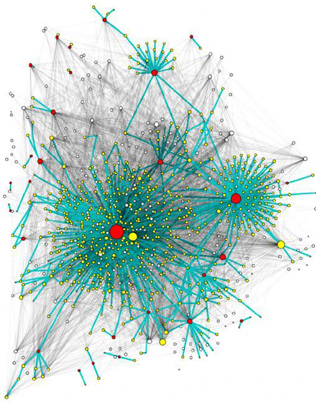
Visualization of a retweet network.
file
175 kB
15-060f14.jpg
Alt text:
Subgraph of the retweet network superimposed to the corresponding followers network.
Caption:
Visualization of retweet network data on Twitter. The retweets network is shown in green, followers network in gray, red nodes are original tweets and yellow nodes are retweets. (Image courtesy of Elsevier, Inc., http://www.sciencedirect.com. Used with permission. Source: Morales, A.J., R.M. Benito et al. “Efficiency of Human Activity on Information Spreading on Twitter.” Social Networks 39 (2014): 1-11.)
Credit:
Courtesy of Elsevier, Inc., http://www.sciencedirect.com. Used with permission. Source: Morales, A.J., R.M. Benito et al. “Efficiency of Human Activity on Information Spreading on Twitter.” Social Networks 39 (2014): 1-11. http://dx.doi.org/10.1016/j.socnet.2014.03.007

Course Info
Departments
As Taught In
Fall
2014
Level
Topics
Learning Resource Types
assignment
Problem Sets
Instructor Insights


