15-136jf13
Description:
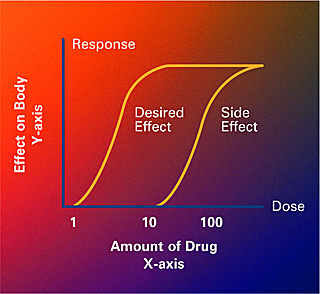
Dose-response curves showing the amount of drug on the x-axis, and effect on the body on the y-axis.
file
51 kB
15-136jf13
Alt text:
Two dose-response curves showing different amounts of a drug on the x-axis, and effect on the body on the y-axis. The resulting curves for "desired effect" and "side effect" both have a steep slope with a slight "S" shape before leveling off at the top.
Caption:
An example of a dose-response curve which shows how much of a drug causes a particular effect or side effect in the body (Crabtree + Company, National Institute of General Medical Sciences).
Credit:
Crabtree + Company, National Institute of General Medical Sciences.

Course Info
Departments
As Taught In
Fall
2013
Level
Topics
Learning Resource Types
notes
Lecture Notes
group_work
Projects
assignment
Presentation Assignments


