
15-433s03-th.jpg
Description:
New image Upload
file
7 kB
15-433s03-th.jpg
Alt text:
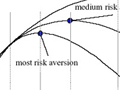
A graph of utility function. The graph indicates risk aversion points.
Caption:
Graph of utility function. (Graph by Prof. Reto Gallati.)
Course Info
Instructor
Departments
As Taught In
Spring
2003
Level
Learning Resource Types
assignment_turned_in
Problem Sets with Solutions
grading
Exams with Solutions
notes
Lecture Notes


