World map showing ecological footprint by region
Description:
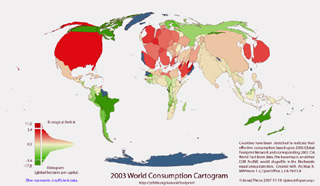
The area of each country has been distorted to represent its consumption, i.e. its ecological footprint. Countries which appear larger than normal are consuming more than their fair earth share and smaller countries are consuming less. (Image courtesy of Jerrad Pierce. Used with permission.)
file
22 kB
World map showing ecological footprint by region
Alt text:
World map showing ecological footprint by region.
Caption:
The area of each country has been distorted to represent its consumption, i.e. its ecological footprint. Countries which appear larger than normal are consuming more than their fair earth share and smaller countries are consuming less. (Image courtesy of Jerrad Pierce. Used with permission.)

Course Info
Departments
As Taught In
Spring
2008
Level
Topics
Learning Resource Types
notes
Lecture Notes
group_work
Projects
assignment
Activity Assignments


