Concept Questions and Discussion
Image 2
file
36 kB
Image 2
Alt text:
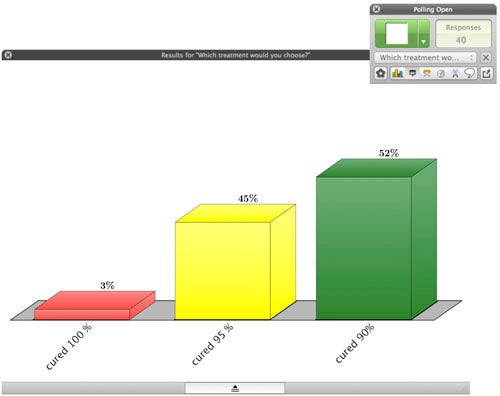
A histogram shows that in response to the question, “Which treatment would you choose?,” 3% of students chose the answer “cured 100%,” 45% chose “cured 95%,” and 52% chose “cured 90%.”
Caption:
Using the clickers allowed us to see students’ responses and gauge their understanding. We either described the distribution of responses to the class or projected the histogram directly.
Disagreements among students served as excellent opportunities for discussions. We often asked students to discuss their answers with their table-mates and try to convince each other. Students could change their answers, and there was often a feedback loop.
Credit:
Image courtesy of OCW.
Course Info
Instructors
Departments
As Taught In
Spring
2014
Level
Learning Resource Types
grading
Exam Solutions
grading
Exams
Instructor Insights
notes
Lecture Notes
theaters
Other Video
assignment_turned_in
Problem Set Solutions
assignment
Problem Sets