
18-238f02-th.jpg
Description:
New image Upload
file
9 kB
18-238f02-th.jpg
Alt text:
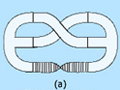
Two figures: a Twisted-fat graph and a Feynman diagram.
Caption:
Two figures from the lecture notes show (a) a Twisted-fat graph and (b) a Feynman diagram. (Images by Prof. Pavel Etingof.)
Course Info
Topics
Learning Resource Types
notes
Lecture Notes
assignment
Presentation Assignments


