
18-303f06-th.jpg
Description:
New image Upload
file
8 kB
18-303f06-th.jpg
Alt text:
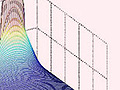
Matlab plot showing time evolution of a temperature distribution.
Caption:
Time evolution of the temperature distribution u(x,t) on a semi-infinite rod whose end (at x=0) is kept at 0. Initially (t=0), the temperature of the rod is 1 between x=0.5 and x=1.5, and is zero everywhere else. (Image by Dr. Matthew Hancock.)
Course Info
Learning Resource Types
grading
Exam Solutions
grading
Exams
notes
Lecture Notes
assignment_turned_in
Problem Set Solutions
assignment
Problem Sets


