< Previous lab day | Module 1 lab index | Next lab day >
Introduction
The amount of RNA recovered after a column purification is quite small. Thus, in the next step of SELEX, you must increase this small amount of RNA in a stable way. First (today) you will convert it to DNA and amplify it, using RT-PCR. Then (next time), you will perform a second in vitro transcription reaction to make more of the RNA aptamer. For this process to work, the 6-5 and 8-12 aptamers must amplify at the same rate, a fact that has been proven for these particular aptamers under the conditions that we are using.
The RT in RT-PCR here stands for reverse transcription, that is, making DNA from an RNA template. We will use a 1-step RT-PCR kit from Qiagen, though the two procedures (reverse transcription and PCR) can be performed separately. The Qiagen kit utilizes a cocktail of two different RT enzymes: Omniscript and Sensiscript, the latter optimized to detect very low abundance sequences. After reverse transcription, these enzymes are inactivated, and a heat-sensitive polymerase is activated so PCR can begin. In sum, the reactions will run for two hours, and we’ll spend this time meeting with the writing across the curriculum faculty.
One somewhat unusual component in your RT-PCR reactions today is BSA, or bovine serum albumin. In the pilot experiments for this module we found that heme itself (which you used during your column elution last time) inhibits the RT-PCR! The inhibition may be due to hydrophobic interactions between heme and the polymerase, and adding a hydrophobic protein such as BSA to compete with this interaction seems to work. In Prof. Niles’s original work, he used a different RT-PCR kit that did not face this inhibition issue, which goes to show that sometimes very subtle factors are at play when an experiment goes wrong! Trouble-shooting is a key part of learning to do research.

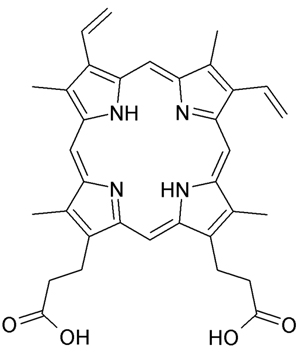
Protoporphyrin IX. (Source: Wikimedia Commons, public domain)
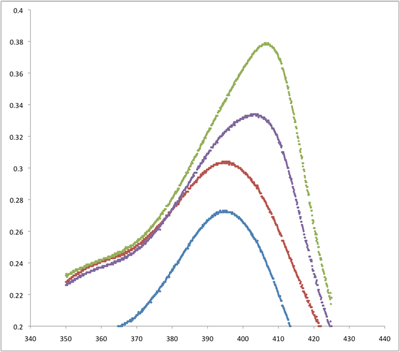
One week from now, you’ll perform the aptamer-heme binding assay, so now is a good time to take a closer look at heme. Heme and similar compounds contain a large porphyrin or proto-porphyrin ring (see figure). The functional unit of porphyrin is a pyrrole, an amine heterocycle; four pyrroles make up a porphyrin. As you may know, conjugated aromatic rings often exhibit interesting spectroscopic or fluorescent properties. Heme’s natural absorbance maximum, or Soret peak, is at about 396 nm. Aptamers that do not bind heme do not affect the location of this maximum, though they may slightly shift the height of the entire curve. However, heme-binding aptamers shift the Soret maximum to about 405 nm, and also substantially increase the magnitude of the peak. See the figure below.

Heme-binding aptamers shift the Soret maximum to about 405 nm, and also substantially increase the magnitude of the peak.
Proptoporphyrin IX is the direct precursor to heme: the enzyme ferrochelatase adds a single iron ion to the center of the PPIX ring to make heme. Heme biosynthesis is interesting in its own right, as this system is an example of negative feedback (see original reference Granick (1966) and review by Ponka (1997)). In other words, an increased concentration of heme in a cell reduces further heme production. (How do you think such a system might work?) In total, 8 enzymes are required for heme biosynthesis, some acting in the cytoplasm and others in the mitochondria. Defects in heme pathway enzymes result in a series of diseases called “porphyrias,” some with severe neurological consequences; treatment can involve patient intake of heme to inhibit the defective synthetic pathway (see review by Ventura, et al. (2009)).
The heme group is part not only of hemoglobin, thus making it essential for oxygen transport, but also a part of many other proteins; heme often serves as an enzyme co-factor. Many heme-containing proteins are ultimately involved in electron transfer – made possible by the flexible charge state of the iron - as in cytochromes, catalases, peroxidases, and chlorophyll.
References
Granick, S. “The Induction in vitro of the Synthesis of Delta-Aminolevulinic Acid Synthetase in Chemical Porphyria: A Response to Certain dDrugs, Sex Hormones, and Foreign Chemicals.” J Biol Chem 241, no. 6 (March 25, 1966): 1359-75.
Ponka, P. “Tissue-Specific Regulation of Iron Metabolism and Heme Synthesis: Distinct Control Mechanisms in Erythroid Cells.” Blood 89, no. 1 (January 1, 1997); 1-25.
Ventura, P., M. D. Cappellini, and E. Rocchi. “The Acute Porphyrias: A Diagnostic and Therapeutic Challenge in Internal and Emergency Medicine.” Intern Emerg Med 4, no. 4 (August, 2009): 297-308.
Protocols
Part 1: Recover RNA
- Centrifuge your samples at max speed for 15 minutes.
- You and partner can balance your tubes against each other.
- Collect the supernatants into a temporary waste bottle, such as a 15 mL conical tube.
- Add 1 mL of 70% ethanol to each sample, and vortex vigorously.
- You should see the pellet come off the tube wall, but it will not be resuspended.
- Spin for two minutes at max speed.
- Repeat the wash step with 1 mL of fresh 70% ethanol.
- Dry your samples in the fume hood for 10 minutes.
- Resuspend each sample in 44 μL of RNase-free water by the following procedure:
- Add the water to the sample, cap tightly, and vortex for 10-20 sec.
- Quick-spin the samples in the microfuge.
- Repeat the vortex and the spin steps one more time.
- Keep your RNA on ice.
Part 2: RT-PCR
- The thermal cycler will be preheated to 50 °C while you prepare your samples. This preparation is required for the procedure to work optimally.
- Set up your reactions on a cold block as usual. From one of the shared stocks, pipet 30 μL of Master Mix into each of two well-labeled PCR tubes.
- In the interests of time and economy, we will not run control reactions this time. However, if you wanted to test for contamination of your reaction, what component would you leave out?
- Add 20 μL of your recovered RNA to the Master Mix.
- The following thermal cycler program will be used:
| SEGMENT | CYCLES | TEMPRATURE (° C) | TIME | PURPOSE |
|---|---|---|---|---|
| 1 | 1 | 50 | 30 min | reverse transcription |
| 2 | 1 | 95 | 15 min | activate polymerase, deactivate RT enzymes, denature template |
| 3-5 | 20 | 94 | 30 sec | denature (PCR) |
| 57 | 1 min | anneal (PCR) | ||
| 72 | 1 min | extend (PCR) | ||
| 4 | 1 | 72 | 7 min | final extension |
Part 3: WAC Session
Today’s WAC session will occur in two parts: (1) a lecture on preparing oral presentations and (2) a lecture on and discussion of the writing exercises that you did (along with scientific writing topics in general).
Part 4:Run RT-PCR Products on Gel
Assuming there is time after the WAC session, you will prepare aliquots of your RT-PCR reactions with loading dye. The teaching faculty will then run your samples on a gel and post the images online. The reactions will be stored at -20 °C until next time.
- Prepare enough diluted loading dye for 2 reactions plus 10% excess.
- The dilution should be 2.5 μL loading dye and 10 μL water per reaction.
- Put 12 μL of diluted loading dye into each of two eppendorf tubes, then add 10 μL of each reaction mixture to said tubes.
Results

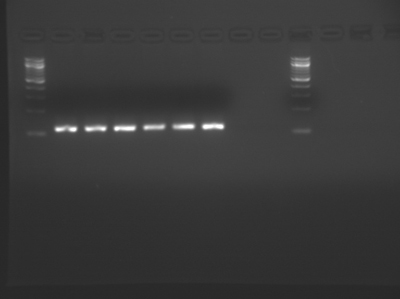
A sample DNA gel showing three group’s data from Module 1, Day 5. Lanes 1 and 10 contain DNA standards of known length (New England BioLabs 100 bp DNA ladder). Lanes 2-7 show RT-PCR products just above 100 bp in size, as expected. Each group ran two reactions, one for each wash condition that they tried. (Results courtesy of Leanna Morinishi, Ariana Chehrazi, Jacqueline Söegaard, and three other anonymous MIT students. Used with permission).
For Next Time
- If you are not presenting for journal club next time, you should work on Part III of the computational assignment, and hand in a picture of the full-length 8-12 sequence with the requested highlighting.
- If you are presenting for journal club, you may hand in the same assignment next week (on Day 7) instead.
Reagent List
- Gel materials as on Day 2
- RT-PCR Master Mix
| COMPONENET | CONCENTRATION | VOLUME |
|---|---|---|
| Primers | 0.6 μM each | 1.5 μL of 20 μM stock, each |
| dNTPs | 400 μM each | 2 μL |
| Enzymes | unknown | 2 μL |
| Reaction buffer | N/A (multi-component) | 10 μL |
| Bovine serum albumin | Not part of the kit, added by us | Final [BSA] = 0.1 %, 0.5 μL added |
| Water | N/A | 12.5 μL (double-check) |
| Template | 1pg-2μg | Added by students, 20 μL |


