These selected lab results are courtesy of the students and used with permission. (T/R blue = Leanna Morinishi and an anonymous MIT student; all other teams anonymous MIT students.)
|
GROUP
|
Corrected A405 values
|
Pre % 8-12:
expected, measured
|
Post % 8-12:
fewer washes, more washes (measured)
|
|
Syntax Sample
|
0.1, 0.2, 0.3
0.4, 0.5, 0.6
|
10%, 12%
|
40%, 50%
|
|
|

_Comments:
_We used Grey group’s 6-5 because we didn’t have any.
|
|
T/R Orange
|
0.1814, 0.182, 0.2368
0.1835, 0.2560, 0.2815
|
2%, 3.3696%
|
4 washes: 134.8675%;
24 washes: 181.1195%
|
|
|
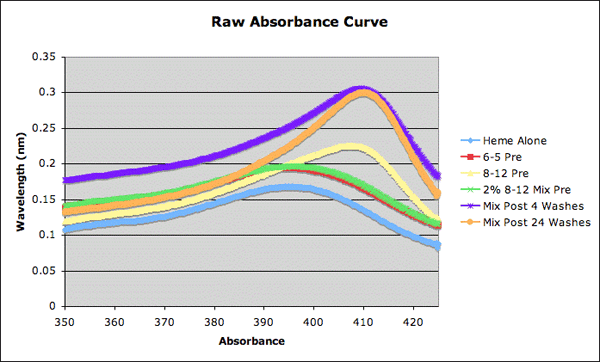
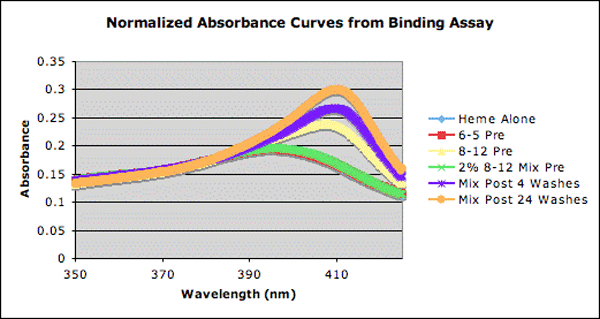
_Comments:
_Only used 1nmols each for the binding assay samples.
Peak shifts are kind of as expected. 8-12 and post mixtures have peaks at a higher wavelength than 6-5 and heme, as expected. However, post mixtures have higher absorbance relative to 8-12 pre absorbance at peaks than expected.
|
|
W/F Yellow
|
0.2623, 0.2580, 0.3333
0.2620, 0.2895, 0.2863
|
2%, 5.4%
|
8 Washes 41.8%;
16 washes 37.6%
|
|
|
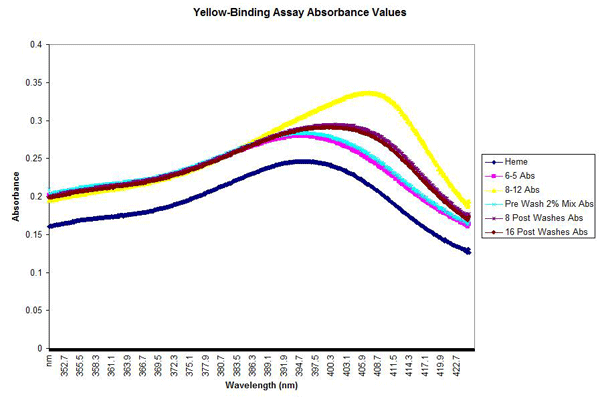
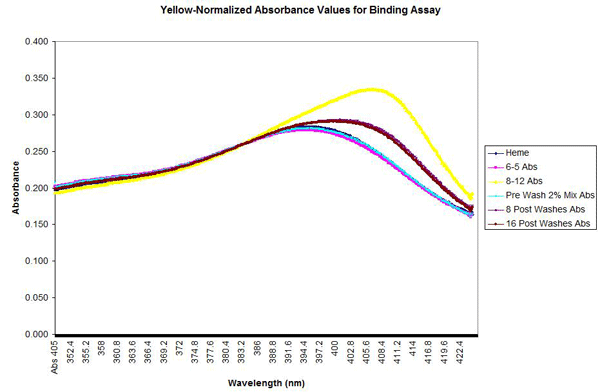
_Comments:
_During the dilution step, we accidentally diluted it to 7.7uM as opposed to the 8uM. (This is estimating final concentration to be 50% 8-12). However, we corrected this by decreasing the amount of heme so that it was still a 1:1 ratio. Therefore, the results should not have been affected. Normalization was used to correct for the heme curve, which was lower than all the other curves. Enrichment values were close to expected ones (50%) but slightly surprising that 8 washes enriched a bit more than 16 washes.
|
|
T/R Green
|
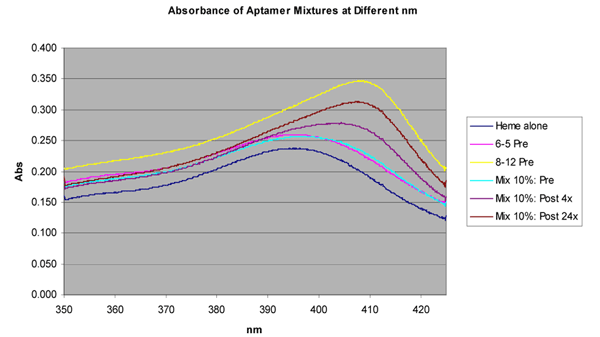
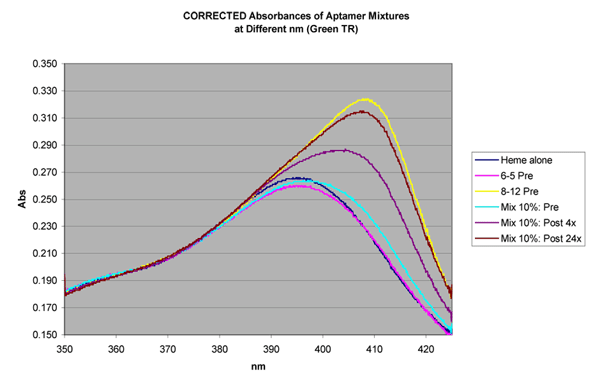
0.244, 0.242, 0.319
0.252, 0.286, 0.312
|
10%, 12.987%
|
4 washes: 57.143%;
24 washes: 90.909%
|
|
|
_Comments:
_Due to the corrections, the heme and 6-5 aptamer horizontal peaks are a little off; the 6-5 aptamer graph should be shifted up from the heme graph at low absorbances, but instead, it’s simply lined up with the heme graph. The other graphs seem consistent with the fact that 8-12 graph should be higher horizontally than the 6-5 graph, with the heights increasing in the following order: mix 10% pre, mix 10% post 4x, post 24x, and 8-12 aptamer.
|
|
W/F Red
|
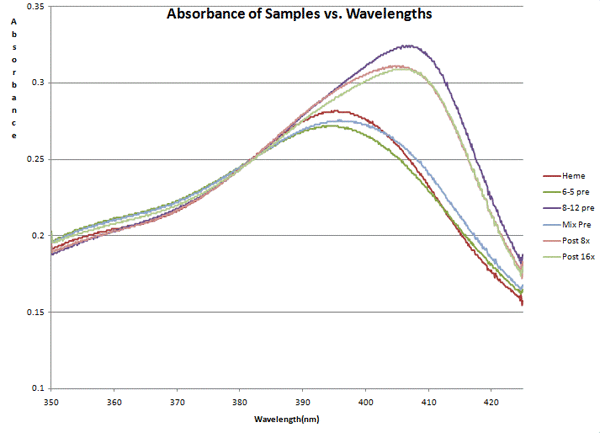
0.260, 0.252, 0.323
0.262, 0.311, 0.30888
|
10%, 14%
|
82.5%
80.9%
|
|
|
|
T/R
Blue
|
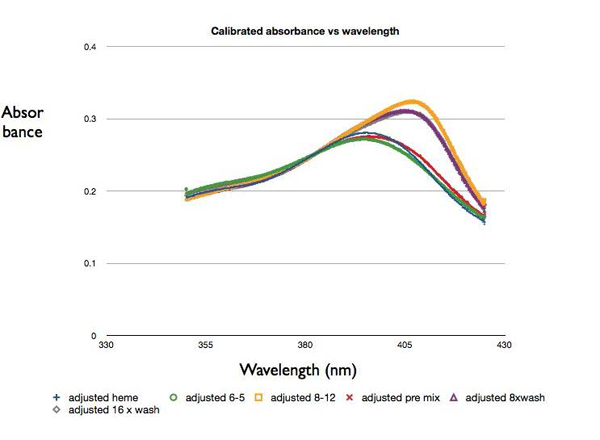
0.261, 0.263, 0.322
0.294, 0.3111, 0.306
|
50%, 52.2905%
|
8 washes: 80.3992%
16 washes: 71.7277%
|
|
|
_Comments:
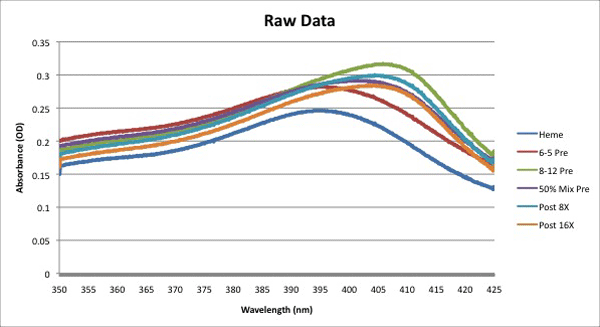
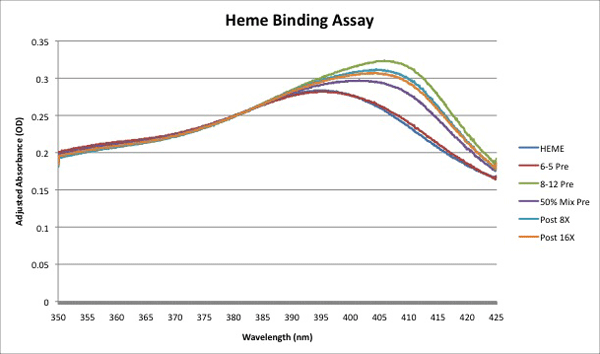
_The difference in observed % 8-12 in our pre-selection mix versus our expected value of 50% could be due to pipetting errors, and the fact that we normalized the absorbance values to our 6-5 pre-selection sample. The values for our post-selection 8-12 percentages make sense but do not exactly correspond to our predictions. We thought that with 8 washes, we’d get about 50% 8-12, but instead we got 80% (meaning our binding assay sample was diluted to less than 8 mM). For 16 washes, we predicted 75% which is close enough to 72% found experimentally. It seems like 8 washes is closer to the ideal number of washes in contrast to our original prediction that 16X would be more optimal. The horizontal peak shifts on our graph are consistent with our findings based on the vertical shifts.
|


