Module 1, Day 5: RNA to DNA by RT-PCR
m1d1_fig2.gif
Description:
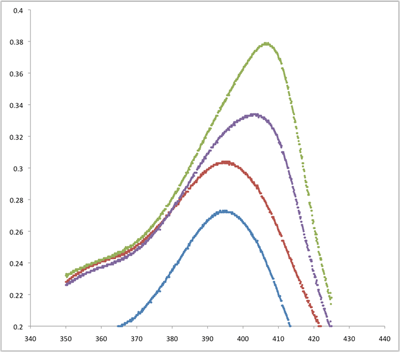
Graph showing the shift of Soret peak caused by heme-binding aptamers.
file
15 kB
m1d1_fig2.gif
Alt text:
Graph of four curves, showing shifting peak from 396 to 405 nm, and peak magnitude growing from 0.27 to 0.38.

Course Info
Instructors
Departments
As Taught In
Spring
2010
Level
Topics
Learning Resource Types
theaters
Other Video
assignment
Presentation Assignments
assignment
Written Assignments
notes
Lecture Notes


