Module 1, Day 7: Results
tr_blue_raw.gif
file
33 kB
tr_blue_raw.gif
Alt text:
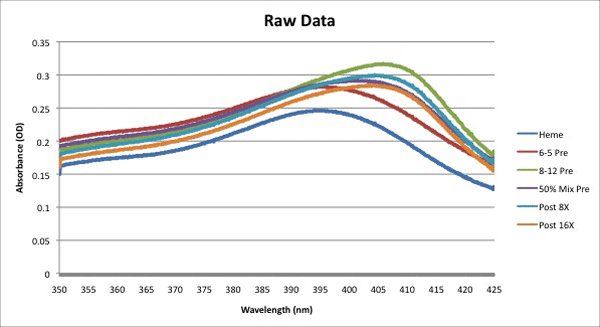
Graph of absorbance vs. wavelength for five different assays, showing increasing absorbance to a peak in the range from 395 nm to 405 nm.

Course Info
Instructors
Departments
As Taught In
Spring
2010
Level
Topics
Learning Resource Types
theaters
Other Video
assignment
Presentation Assignments
assignment
Written Assignments
notes
Lecture Notes


