Creating figures for scientific papers
Description:
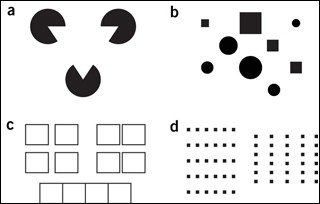
Creating figures for scientific papers is discussed in the course, including Gestalt principles for how we interpret visual data. (a) An illustration of subjective contour. (b) Similar objects are visually grouped. (c) Objects placed close to one another are seen as going together. (d) Relative proximity elicits vertical or horizontal correlations between objects. (Reprinted by permission from Macmillan Publishers Limited: Nature. Source: Wong, Bang. “Points of View: Gestalt Principles (Part 1).” Nature Methods 7, no. 11 (2010): 863.)
file
16 kB
Creating figures for scientific papers
Alt text:
A is three black circles with a white triangle superimposed. B is a smattering of black circles and squares of various sizes. C is squares arranged together. D is pixels arranged in matrix with different spacing between the rows and columns.
Caption:
Creating figures for scientific papers is discussed in the course, including Gestalt principles for how we interpret visual data. (a) An illustration of subjective contour. (b) Similar objects are visually grouped. (c) Objects placed close to one another are seen as going together. (d) Relative proximity elicits vertical or horizontal correlations between objects. (Reprinted by permission from Macmillan Publishers Limited: Nature. Source: Wong, Bang. “Points of View: Gestalt Principles (Part 1).” Nature Methods 7, no. 11 (2010): 863.)
Credit:
Macmillan Publishers Limited.

Course Info
Instructors
Departments
As Taught In
Fall
2014
Level
Learning Resource Types
Instructor Insights


