
5-73f18-th
Description:
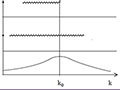
A graph showing an integral and rapidly oscillating integrands.
file
19 kB
5-73f18-th
Alt text:
A plot showing a bell-shaped curve along the bottom near the x-axis, and three different horizontal jagged lines above, at three different points along the y-axis.
Caption:
From Lecture #3 Notes: Learn how to determine the value of the integral without actually evaluating the integral. Amaze your friends!
Credit:
By Sbyrnes321 - Own work, Public domain, Wikimedia Commons
Course Info
Learning Resource Types
grading
Exams with Solutions
notes
Lecture Notes


