6-5060s23.jpg
Description:
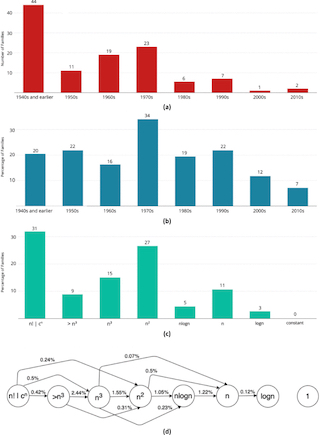
Graphs like these explore algorithm discovery and improvement such as the number of new algorithm families discovered by decade, improvements to algorithm families, and complexity classes of discovered algorithms. (Image courtesy of Sherry and Thompson. License: CC BY.)
file
78 kB
6-5060s23.jpg
Alt text:
Multiple graphs. First graph is algorithm families discovered by decade. Second is percentage of families improved per decade. Third is percentage of algorithms by time complexity. Fourth is diagram showing yearly probability of algorithm changing complexity.
Caption:
Graphs like these explore algorithm discovery and improvement such as the number of new algorithm families discovered by decade, improvements to algorithm families, and complexity classes of discovered algorithms. (Image courtesy of Sherry and Thompson. License: CC BY.)
Credit:
Image courtesy of Sherry and Thompson. License: CC BY.

Course Info
Instructors
Departments
As Taught In
Spring
2023
Level
Learning Resource Types
Readings
notes
Lecture Notes


