
mit6_c35_s25.jpg
Description:
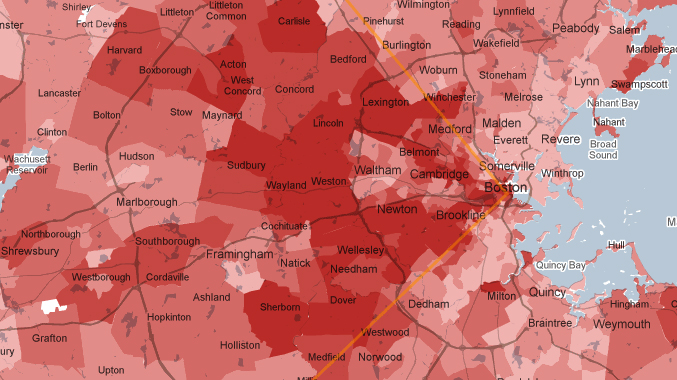
Students learn data visualization techniques, with a special focus on housing affordability in Greater Boston. Map courtesy of Payton Chung (paytonc) on Flickr. (License: CC BY.)
file
263 kB
mit6_c35_s25.jpg
Alt text:
A map of the Greater Boston area, with neighborhoods colored in shades of red. An orange line delineates an arc of favored suburbs stretching west of Boston.
Caption:
Students learn data visualization techniques, with a special focus on housing affordability in Greater Boston. Courtesy of Payton Chung (paytonc) on Flickr. (License: CC BY.)
Credit:
Courtesy of Payton Chung (paytonc) on Flickr. (License: CC BY.)
Course Info
Departments
As Taught In
Spring
2025
Level
Topics
Learning Resource Types
assignment
Laboratory Assignments
notes
Lecture Notes
assignment
Multiple Assignment Types
group_work
Projects
auto_stories
Readings


