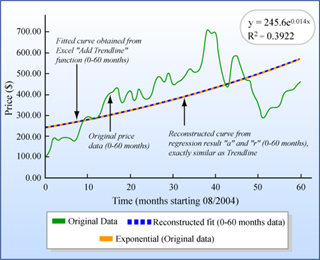
Graph of value against time for original price data, fitted curve from trendline, and reconstructed curve from regression
Description:
Graphical result of computing average growth rate and volatility for Google stocks, based on original stock price data. See the Session 3 lecture and spreadsheets in the Lecture Notes section. (Figure by MIT OpenCourseWare.)
file
57 kB
Graph of value against time for original price data, fitted curve from trendline, and reconstructed curve from regression
Alt text:
Graph of value against time for original price data, fitted curve from trendline, and reconstructed curve from regression.
Caption:
Graphical result of computing average growth rate and volatility for Google stocks, based on original stock price data. See the Session 3 lecture and spreadsheets in the Lecture Notes section. (Figure by MIT OpenCourseWare.)

Course Info
Instructors
As Taught In
Fall
2009
Level
Learning Resource Types
assignment
Problem Sets
notes
Lecture Notes


