
Investigation 3 Image 7
file

17 kB
Investigation 3 Image 7
Alt text:
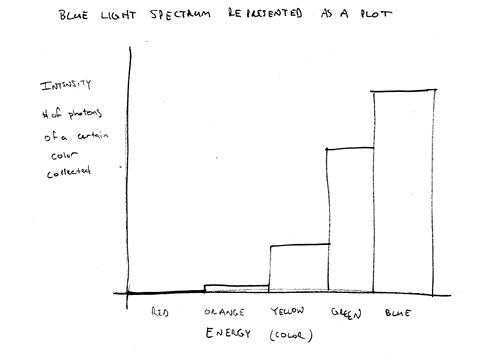
A hand drawn graph showing the blue light spectrum represented as a plot. The x axis is "energy (color) with red, orange, yellow, green, and blue. The y axis is intensity # of photons of a certain color collection. In the graph, there is no red, a tiny bit of orange, and then yellow, green, and blue bars get bigger in succession.
Caption:
Blue light spectrum represented as a plot.
Credit:
Image courtesy of Peter Ashton, Simba Kol, Shakib Ahmed
Course Info
Instructors
As Taught In
Level
Learning Resource Types
assignment
Activity Assignments
theaters
Lecture Videos


