
Investigation 3 Image 17
file

35 kB
Investigation 3 Image 17
Alt text:
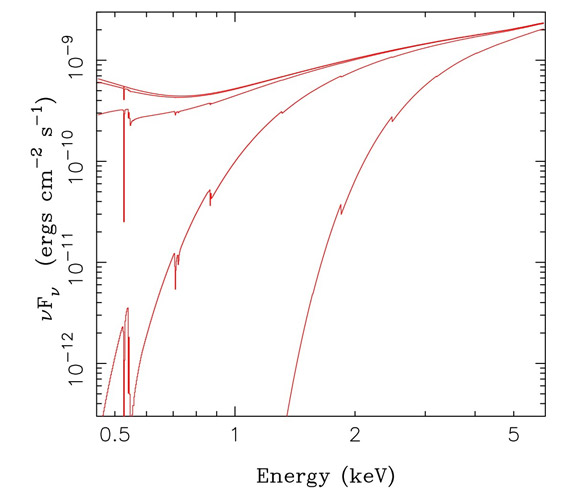
A graph showing how interstellar dust affects X Rays. The top line is for almost no dust, and then the lines further down represent the low, medium and highest amount of dust that is likely to be between Chandra and most X-ray sources. The Y-axis essentially represents the amount of light which is able to pass through the dust. In other words, the more dust, the less likely we are to collect low energy photons.
Credit:
Image courtesy of Peter Ashton, Simba Kol, Shakib Ahmed
Course Info
Instructors
As Taught In
Level
Learning Resource Types
assignment
Activity Assignments
theaters
Lecture Videos


