
Investigation 3 Image 26
file
19 kB
Investigation 3 Image 26
Alt text:
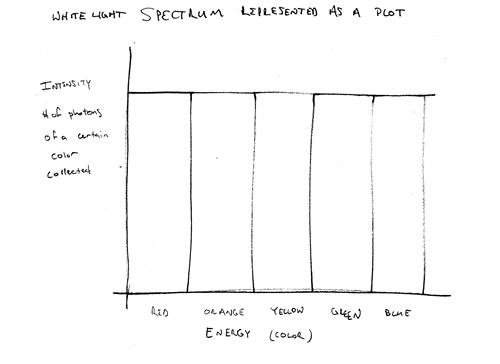
A plot graph titled "White Light Spectrum Represented as a Plot." The x axis is labeled with "energy (color) and red, orange, yellow, green, and blue. The y axis is labeled Intensity # of photons of a certain color collected.
Caption:
White light spectrum represented as a plot.
Credit:
Image courtesy of Peter Ashton, Simba Kol, Shakib Ahmed
Course Info
Instructors
As Taught In
Level
Learning Resource Types
assignment
Activity Assignments
theaters
Lecture Videos


