
The following charts, based on data from Gustavsson et al. (2011), compare food losses for cereals, fruits and vegetables, and meat in different geographical regions. The charts are based on “edible food mass”, which is equivalent to the “wet weight” value used in Alexander et al (2017).
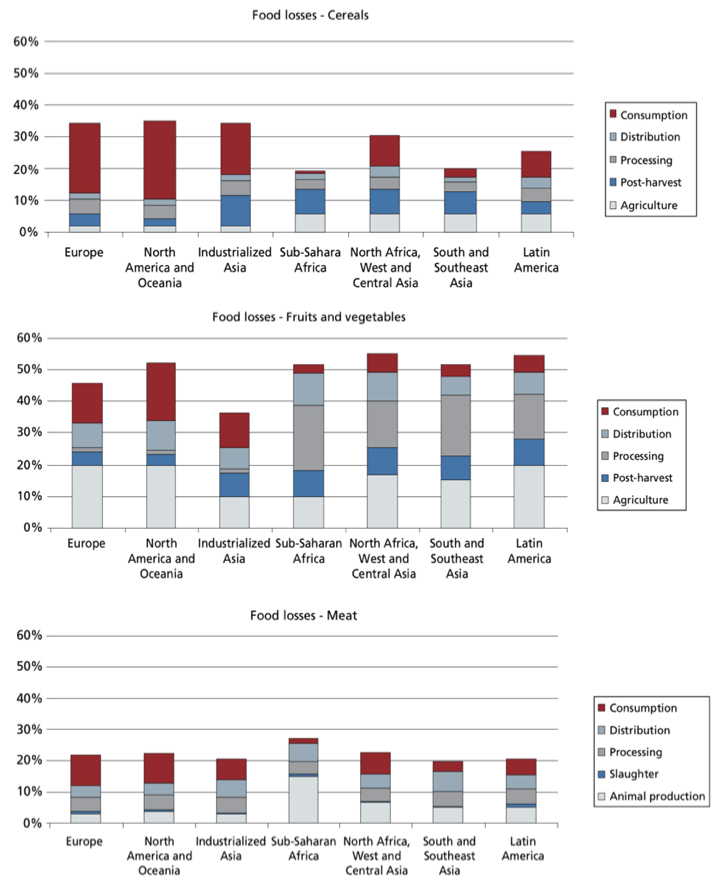
Figure S2.1 FAO estimated food loss and waste by crop type and region (Gustavsson et al., 2011)
© FAO. All rights reserved. This content is excluded from our Creative Commons license.
For more information, see https://ocw.mit.edu/help/faq-fair-use/.
These estimates indicate that consumption losses are the largest fraction of the total in the developed countries of Europe and North America while pre-consumer production losses are largest in the developing countries of sub-Saharan Africa and South Asia. This probably reflects greater consumer waste in developed countries and poorer storage and transportation in developing countries. In both cases, total losses for cereals are generally over 20%. Vegetables and fruit losses can be much higher than 30%.
References:
Peter Alexander, Calum Brown, et al. 2017. “Losses, Inefficiencies and Waste in the Global Food System.” Agricultural Systems, 153, no. 2017: 190–200.
Jenny Gustavsson, Christel Cederberg, et al. 2011. “Global Food Losses and Food Waste: Extent, Causes and Prevention.” Report commissioned by Food and Agriculture Organization (FAO) of the United Nations.


