
FAO’s Food Balance Sheets provide helpful information on the supply and utilization of different food products as well as information on per capita energy, protein, and fat consumption. Data from these balance sheets have been used in some of the calculations provided elsewhere in Supporting Information.
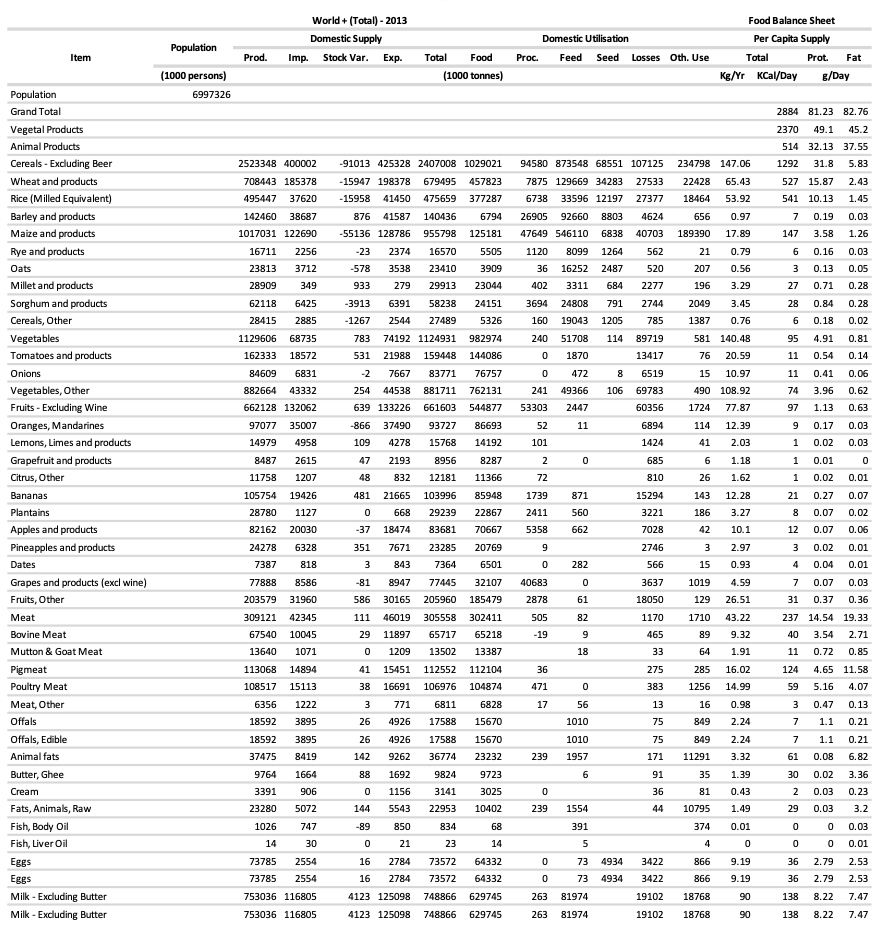
The food balance sheets are available at the FAOSTAT website under “Food Balance”. There are two versions: “Food Balances (old methodology and population)” for the years 2013 and earlier and “New Food Balances” for years after 2013. The data can be reported as global, regional or national totals by year. They can also be downloaded to a spreadsheet. An example is the excerpt from the 2013 global summary given below. This summary was obtained with the “Report” option in the “Food Balances (old methodology and population)” version. The “Report” option is, unfortunately, not available for years after 2013 but similar tables for these years can be constructed outside of FAOSTAT from downloaded raw data.
© FAO. All rights reserved. This content is excluded from our Creative Commons license. For more information, see https://ocw.mit.edu/help/faq-fair-use/.
The entries for each crop and group of crops listed in the Food Balance Sheets are organized as follows:
Domestic supply (1000 metric tonnes):
- Domestic production (harvested)
- Imports
- Additions or withdrawals from stock
- Exports
- Net supply
Domestic utilization (1000 tons):
- Human food
- Processing
- Animal feed
- Seed
- Post-harvest losses
- Other uses
The columns on the far right give the nutritional contributions of each crop in terms of per capita mass (Kg person-1 year-1), energy (kcal person-1 day-1), protein and fat (both in g person-1 day-1).
As an example, the “Grand Total” row near the top of the above chart indicates that the global average per capita energy consumed in 2013 was 2884 KCal person-1 day-1 and the global average per capita protein consumed was 81.23 g person-1 day-1. The “Cereals” row just below indicates that 1.029x10⁹ tonnes of global cereal production in 2013 was consumed as human food while 0.873x10⁹ tonnes was consumed as animal feed. Cereals provided, on average, 1292 KCal person-1 day-1 of energy and 31.8 g person-1 day-1 of protein.
The Food Balance entries should be interpreted as rough estimates. The data are obtained from national sources that vary greatly in quality. Also, be careful of label formatting errors in the headings on the “Food Balances (old methodology and population)” reports for years through 2013 (these have been corrected in the chart provided above).
The FAOSTAT website provides access to many other data bases relevant to agriculture, including information on production, trade, investment, prices, inputs, emissions, and land use.


