
Figure S6.1 shows how water in its various physical forms moves on, above, and below the earth’s surface in a cycle that drives, among other things, crop production (Trenberth et al., 2007):
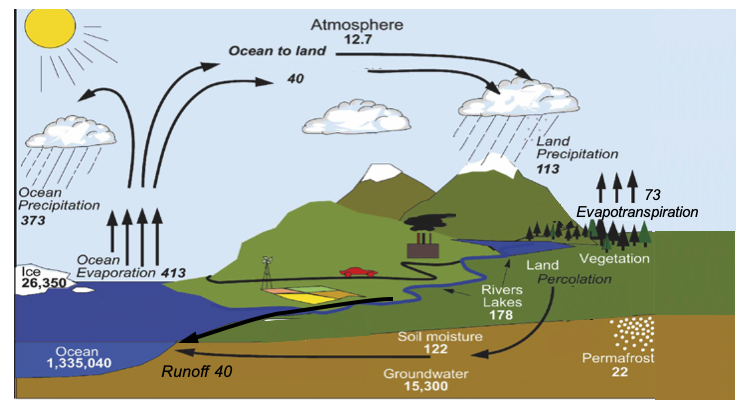
Figure S6.1 The global water cycle. Storages in 103 km3, fluxes in 103 km3 yr-1 (based on Trenberth et al., 2007).
Hydrologists tend to quantify the water cycle in terms of liquid or vapor water fluxes between various compartments that are defined according to application. The above global water cycle diagram includes the following compartments (with water storage noted in 103 km3):
Ocean 1.34 106
Ice 2.63 103
Groundwater 1.53 103
Rivers and lakes 1.78 102
Soil moisture 1.22 102
Permafrost 2.20 101
Atmosphere 1.27 101
The primary fluxes between compartments are (with flux rate noted in 103 km3yr-1).
Precipitation
Land 113
Ocean 373
Evapotranspiration
Land 73
Ocean 413
Runoff
Surface + subsurface 40
Lateral atmospheric
Ocean to land (net) 40
These flux and storage estimates, which collectively form a water budget, are generally compatible with the fluxes provided in Fig 1 of Postel et al. (1996). It should be noted that the global water budget gives only a generalized view of the water cycle since local and regional fluxes vary considerably from the average global value. This is apparent in the global climate maps shown in S8.
Some researchers distinguish two types of water fluxes relevant for the production of agricultural or other goods:
- Blue water is water that flows into and through streams, rivers, lakes, and aquifers. Most irrigation water is diverted blue water.
- Green water is the portion of soil moisture that originates from direct precipitation. It is either evapo-transpired or incorporated into plant biomass but does not include runoff, which is blue water. Green water is the primary water source for rainfed crops.
Figure S6.2 shows the part of the water cycle that describes the conversion of precipitation over land into evapotranspiration and runoff (surface plus subsurface). It is based on Figure 1 of Postel et al. (1996) but uses the same flux values as Figure S6.1 above. The figure shows in color the division between blue and green water. The portion of precipitation falling on agricultural land (crops, pasture, and forestry) and subsequently evapotranspired as green water (18 103 km3) is significantly larger than the amount diverted from runoff as irrigation and then evapotranspired (3.5 103 km3).
Typically, blue irrigation water is used to make up part or all of the deficit that occurs when a crop’s water needs are not met by green water alone. Although green water deficits may occur for relatively short periods during the growing season, they may stress the crop sufficiently to reduce yield. Irrigation generally improves yield by providing a more reliable water supply. Rosa et al. (2020) discusses distinctions between blue and green water and defines water scarcity indices for both (Class 3).
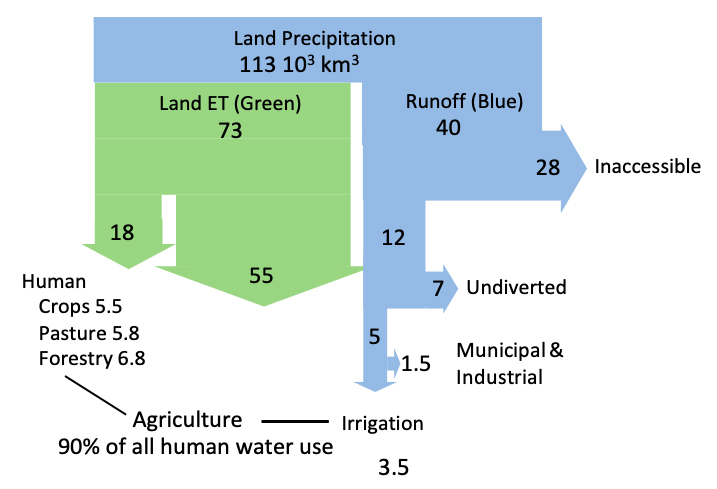
Figure S6.2 Water appropriated for human uses, showing how total precipitation on land divides into green and blue fractions.
Based on Postel (1996), Rost (2008), and FAO (2014).
References:
FAOSTAT http://www.fao.org/faostat/en/#data, accessed 2019.
Sandra L. Postel, Gretchen C. Daily, and Paul R. Ehrlich. 1996. “Human Appropriation of Renewable Fresh Water.” Science. 271, no. 5250: 785–788.
Lorenzo Rosa, Davide Danilo Chiarelli, et al. 2020. “Global Agricultural Economic Water Scarcity.” Science Advances. 6, no. 18: eaaz6031.
S. Rost, Dieter Gerten, et al. 2008. “Agricultural Green and Blue Water Consumption and Its Influence on the Global Water System.” Water Resources Research, 44, no. 9.
Kevin E. Trenberth, Lesley Smith, et al. 2007. “Estimates of the Global Water Budget and Its Annual Cycle Using Observational and Model Data.” Journal of Hydrometeorology, 8, no. 4: 758–769.


