
S1. UN Global and Regional Population Projections
FigS1-3pop.jpg
file

383 kB
FigS1-3pop.jpg
Alt text:
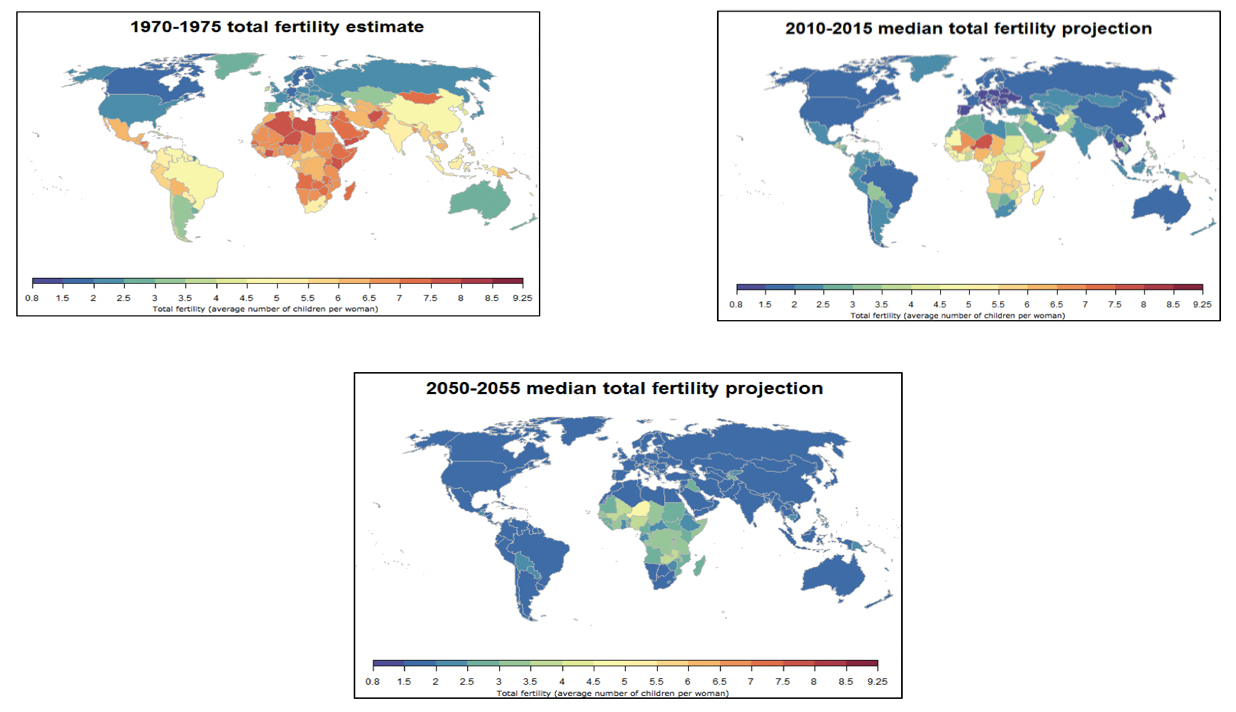
Three maps showing fertility rates over three time periods.
Caption:
Figure S1.3 Fertility rates over three time periods.
Credit:
Figures based on data from UN Population Division (2013).
Course Info
Instructor
Departments
As Taught In
Fall
2020
Level
Topics
Learning Resource Types
Instructor Insights
notes
Lecture Notes
podcasts
Podcasts


