14-30s06.jpg
Description:
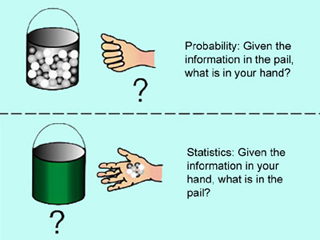
Diagram showing the difference between statistics and probability. (Image by MIT OCW. Based on Gilbert, Norma. Statistics. W.B. Saunders Co., 1976.)
file
75 kB
14-30s06.jpg
Alt text:
The course covers elements of probability theory, sampling theory, statistical estimation, regression analysis, and hypothesis testing.
Caption:
Diagram showing the difference between statistics and probability. (Image by MIT OpenCourseWare. Based on Gilbert, Norma. Statistics. Philadelphia, PA: W. B. Saunders Co., 1976. ISBN: 072164127X.)

Course Info
Learning Resource Types
grading
Exams with Solutions
notes
Lecture Notes
assignment_turned_in
Problem Sets with Solutions


