mit14_310x_s23_chp.png
file
83 kB
mit14_310x_s23_chp.png
Alt text:
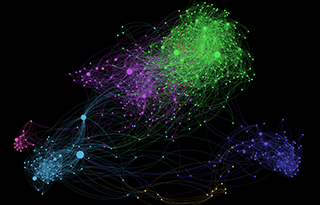
A data visualization that uses green, purple, teal, blue, and pink to represent clusters of Facebook users.
Caption:
A visualization of a Facebook network of 1000+ friends in Somalia. (Image by Kimo Quaintance. Used with permission.)
Credit:
Image by Kimo Quiantance. Used with permission.

Course Info
Instructors
Departments
As Taught In
Spring
2023
Level
Learning Resource Types
notes
Lecture Notes
theaters
Lecture Videos
assignment
Problem Sets
Podcasts


