
14-462s04.jpg
file
86 kB
14-462s04.jpg
Alt text:
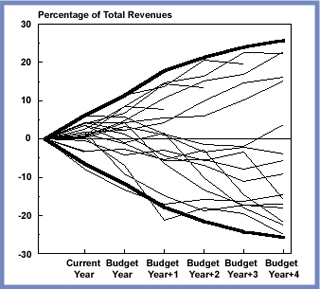
A line chart of Percent of Total Revenues versus Budget Years.
Caption:
U.S. Congressional Budget Office’s Past Inaccuracies in Projecting the Primary Surplus, Compared with the Constructed 90 Percent Confidence Range. Note: Each thin line represents the actual inaccuracies of the set of projections made in a given year. The thick lines represent the 90 percent confidence range constructed from CBO’s statistical model for inaccuracies. That range encompasses nearly all of CBO’s past record. (Image courtesy of the Congressional Budget Office.)
Course Info
Instructors
Departments
As Taught In
Spring
2004
Level
Learning Resource Types
grading
Exam Solutions
grading
Exams
notes
Lecture Notes
assignment_turned_in
Problem Set Solutions
assignment
Problem Sets


