
15-031js12.jpg
Description:
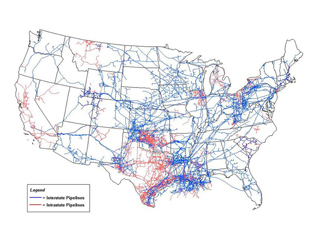
An infographic depicting natural gas pipelines across the U.S. Image courtesy of Energy Information Administration.
file
90 kB
15-031js12.jpg
Alt text:
Map of the United States with red and blue lines extending within and across states.
Caption:
An infographic depicting natural gas pipelines across the U.S. (Image courtesy of Energy Information Administration.)
Credit:
Image courtesy of Energy Information Administration.
Course Info
Instructor
As Taught In
Spring
2012
Level
Topics
Learning Resource Types
Instructor Insights
notes
Lecture Notes
theaters
Lecture Videos
assignment
Written Assignments


