
15-433s03.jpg
file
58 kB
15-433s03.jpg
Alt text:
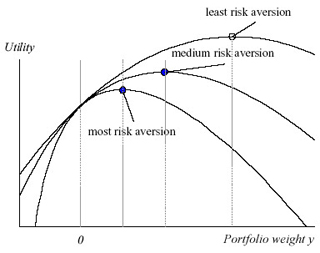
A graph of utility function. The graph indicates risk aversion points.
Caption:
Graph of utility function. (Graph by Prof. Reto Gallati.)
Course Info
Instructor
Departments
As Taught In
Spring
2003
Level
Learning Resource Types
grading
Exam Solutions
grading
Exams
notes
Lecture Notes
assignment_turned_in
Problem Set Solutions
assignment
Problem Sets


