
2016 Midterm Exam
17-251F16-2016MidtermGraph.jpg
Description:
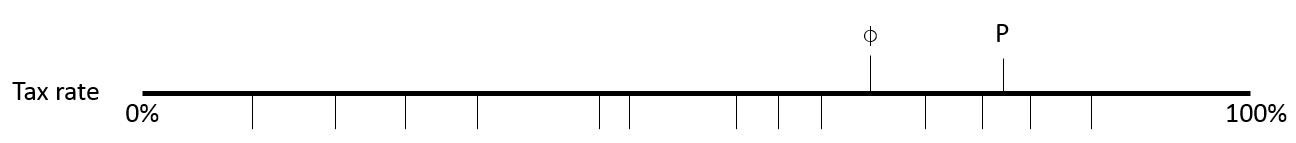
A graph drawn by the professor for use in the 2016 midterm question.
file

9 kB
17-251F16-2016MidtermGraph.jpg
Alt text:
A graph showing the ideal points of the marginal tax rate for people who make a million dollars a year.
Caption:
no caption required
Credit:
no credit line required
Course Info
Instructor
Departments
As Taught In
Fall
2016
Level
Learning Resource Types
assignment
Activity Assignments
grading
Exams
notes
Lecture Notes
assignment
Presentation Assignments


