7-91js14.jpg
Description:
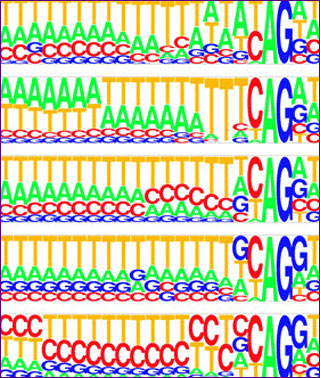
Splice signal motifs of five species, created using the PICTOGRAM program. The height of each letter is proportional to the frequency of the corresponding base at the given position, and bases are listed in descending order of frequency from top to bottom. Courtesy of National Academy of Sciences. Source: Figure 2 of Lim, Lee P., and Christopher B. Burge. “A computational analysis of sequence features involved in recognition of short introns.” Proceedings of the National Academy of Sciences 98, no. 20 (2001): 11193-11198. Courtesy of National Academy of Sciences.
file
71 kB
7-91js14.jpg
Alt text:
The letters A, T, G, and C, presented in different sizes and colors.
Caption:
Splice signal motifs of five species, created using the PICTOGRAM program. The height of each letter is proportional to the frequency of the corresponding base at the given position, and bases are listed in descending order of frequency from top to bottom. Source: Figure 2 of Lim, Lee P., and Christopher B. Burge. “A Computational Analysis of Sequence Features Involved in Recognition of Short Introns.” Proceedings of the National Academy of Sciences 98, no. 20 (2001): 11193–8. (Courtesy of National Academy of Sciences)
Credit:
Courtesy of National Academy of Sciences.

Course Info
Departments
As Taught In
Spring
2014
Level
Topics
Learning Resource Types
theaters
Lecture Videos
notes
Lecture Notes
group_work
Projects
assignment_turned_in
Programming Assignments with Examples
assignment
Presentation Assignments
assignment
Written Assignments
Instructor Insights


