
ES-S10s13.jpg
file
108 kB
ES-S10s13.jpg
Alt text:
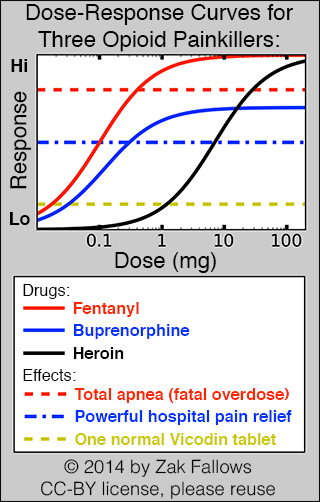
A graph showing the dose-response curves for Fentanyl, Buprenorphine, and Heroin.
Caption:
The dose-response curve is probably the most iconic graph from the science of pharmacology. The graph above shows the dose-response curves for three common opioid painkillers. Notice that fentanyl is 70 times more potent than heroin, but addicts and drug abusers generally prefer heroin. Buprenorphine is about 25 times more potent than heroin but it has a lower intrinsic efficacy (IE). As a result, the solid blue buprenorphine line never crosses the dashed red total apnea line. This means that even a massive overdose of buprenorphine will not cause total apnea (total cessation of breathing), so doctors can safely give buprenorphine to recovering addicts. More details on the course home graphic. (Image courtesy of Zak Fallows.) CC-BY.
Course Info
Instructor
Departments
As Taught In
Spring
2013
Level
Learning Resource Types
grading
Exams with Solutions
notes
Lecture Notes
Instructor Insights


