Basic Plotting
Unit_3_image.jpg
Description:
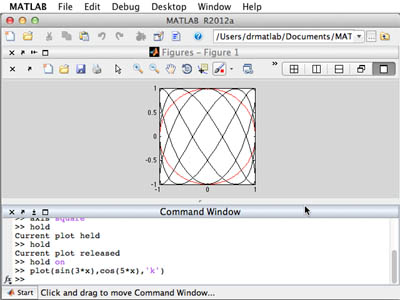
MATLAB can graph both functions and non-functions, as demonstrated by the circle and Lissajous curves. (Photograph courtesy of Yossi Farjoun. Used with permission.)
file
34 kB
Unit_3_image.jpg
Alt text:
Screenshot of plot commands and resultant red circle and black Lissajous curves.
Caption:
MATLAB can graph both functions and non-functions, as demonstrated by the circle and Lissajous curves.
Credit:
Photograph courtesy of Yossi Farjoun. Used with permission.

Course Info
Topics
Learning Resource Types
assignment
Problem Sets
theaters
Lecture Videos
menu_book
Online Textbook
assignment_turned_in
Programming Assignments with Examples


