Modules: 2.1 | 2.2 | 2.3 | 2.4 | 2.5 | 2.6
Introduction
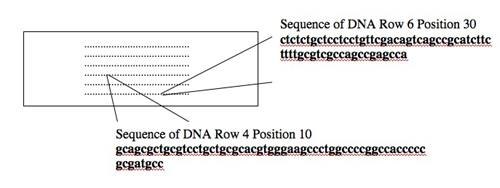
Today you will use one tool, a DNA microarray, to simultaneously examine the expression of many genes. DNA microarrays are slides with DNA sequences spotted in a known order on the surface. The spots of DNA, each one smaller than the period at the end of this sentence, are placed on the slide surface with robotic arms or built one base at a time with photolithography. Each spot of DNA gets a unique address on the slide surface, and the identity and location of each spot get stored in the computerized “design file” for the array. The slide shown below is the same size as the one you’ll use (1 x 3 inches) but yours will have 4 arrays each with 44,000 spots of DNA instead of the 250 dots shown!

DNA microarrays are slides with DNA sequences.
Consider the two spots highlighted on the microarray shown above (an array of human genes for this example). The first spot, in Row 6 Position 30, is a 60-nucleotide sequence from the human gene for glyceraldehyde-3-phosphate dehydrogenase (GAPD). This gene, which encodes an essential metabolic enzyme, has been called a “housekeeping” gene since it must be expressed in all human cells no matter how specialized. Other housekeeping genes include those for ACTB (encoding a cytoskeletal protein), TBP (encoding a general transcription factor), HPRT (encoding an enzyme required for nucleotide transport and metabolism), and PPIA (encoding an enzyme important for protein folding). The second spot highlighted on the array, in Row 4 Position 10, is a 60-nucleotide sequence from the human TERT gene. This gene encodes the protein subunit of telomerase, an enzyme that adds telomere repeats (TTGGGGTTG) to the end of chromosomes. As healthy cells age and divide, telomere repeats are lost. Cancerous cells express telomerase and so the telomeres do not shorten. Consequently, these cells “lose track” of how old they are and become immortal.
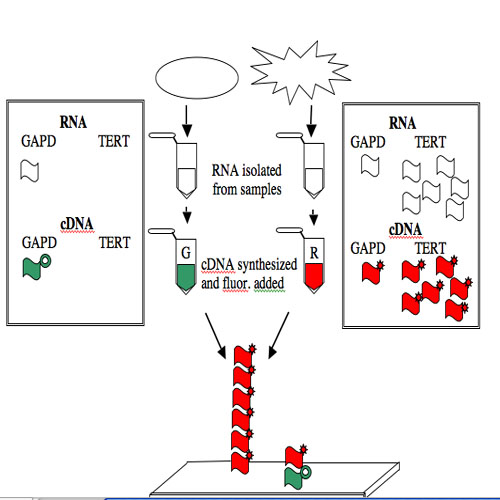
The GAPD and TERT spots can be used to illustrate how microarray data is generated and interpreted. Consider a group of “normal” human cells and a cancerous version of them. RNA from each type of cell can be isolated (you’ve seen how quick and easy it is to isolate RNA), converted from RNA into a complementary strand of DNA (called cDNA), and then “color coded.” The most commonly used molecules for color-coding are the green-fluorescing cyanine 3 (Cy3) and the red-fluorescing cyanine 5 (Cy5).
For this example, the normal cells get green and the cancerous cells get red. The two colored samples are mixed and then simultaneously hybridized to a DNA microarray. The DNA spotted on the surface of the slide is in vast excess to either colored cDNA sample and so the intensity of each color will vary with the amount of RNA originally present in each sample. A gene expressed similarly in normal and cancerous cells, like the housekeeping GAPD gene, will give rise to a yellow spot in Row 6 Position 30 since equal amounts of green and red cDNA will be bound there and the merged color will appear yellow. By contrast, only red cDNA will bind at Row 4 Position 10 since cancerous cells express telomerase and normal cells do not.

The GAPD and TERT spots can be used to illustrate how microarray data is generated and interpreted.
NOTE: The cDNAs are not really piled on top of one another on the array. Rather they are hybridized side by side to the spot of DNA that is on the surface of the slide.
With an expensive machine, the slide is “scanned” to measure the intensity of the red and green light at each spot (remember we’re talking about thousands of spots!) and the data can then be assessed and normalized. Corrections are often made to account for differences between Cy3 and Cy5 incorporation into the cDNA as well as how much of each fluorescent molecule sticks non-specifically to different areas of the slide. These are things you will do next time with your own data.
Protocols
Today you will convert the RNA isolated from your mouse cells into cDNA and hybridize the cDNA to a DNA microarray.
Part 1: cDNA Synthesis
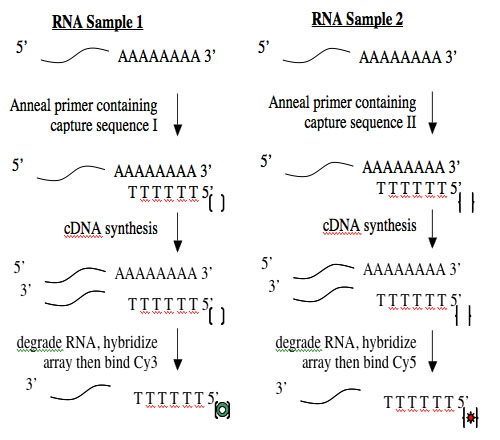
Creating cDNA from RNA is done using an enzyme called reverse transcriptase. Like all DNA polymerases, this enzyme can only add sequence to an existing chain and so needs a short “primer” to begin synthesis. To perform the cDNA synthesis, you will use a kit from a company named Genisphere. The primers in this kit have a special “capture sequence” at their 5’ end. The capture sequences allow the cDNA to be reacted with Cy3 or Cy5 later.

Creating cDNA from RNA is done using an enzyme called reverse transcriptase.
Before you begin today’s protocol, prepare your bench for working with RNA. This involves cleaning your pipetmen, retrieving your “RNA only” pipet tips and solutions and wiping down your bench. You should work on a fresh piece of benchpaper and remember to wear gloves when working with RNA.
Calculate the volume needed for 4 ug of each RNA sample, then assemble the annealing reactions in RNase-free eppendorf tubes according to the following table. If you need more than 10 µl for 4 ug of RNA then you should calculate the mass in 10 µl of the more dilute sample and match that mass for the more concentrated sample. You cannot put a volume of RNA greater than 10 µl in the tubes.
| TUBE A | TUBE B | |
|---|---|---|
| RNA | 4 µg of RNA from the control sample | 4 µg of RNA from the experimental sample |
| RNase-free H20 | Bring volume to 10 µl | Bring volume to 10 µl |
| RT primer |
1 µl Capture Sequence I vial 11, red |
1 µl Capture Sequence II vial 11, blue |
- Heat the annealing reactions to 80°C for 10 minutes then place the tubes on ice for 2 minutes.
- Microfuge the tubes briefly to spin any condensation or droplets down to the bottom of the tube then add 1 µl of “Superase,” an RNase inhibitor (Vial 4), and 8 µl of cDNA synthesis cocktail. Because reverse transcriptase is an unstable enzyme, this cocktail must be prepared just before use. The teaching faculty will prepare some for you when you are ready for it.
- Pipet the contents of your tubes up and down to gently mix, then incubate the cDNA synthesis reactions at 42° for 1.5 hours. During this time, work with the sample array data file that is available (see Part 2 of today’s protocol).
- Microfuge the tubes briefly then add 3.5 µl of 0.5M NaOH/0.5M EDTA to each tube and pipet up and down to mix. Heat to 65°C for 10 minutes. This step will denature your RNA/cDNA hybrids and degrade the RNA.
- Add 5 µl of 1M Tris, pH7 to neutralize the contents of each tube.
Part 2: Practice Array Data Analysis
Data for these exercises (XLS)
You can decide to take notes on this in your notebook or to skip it…up to you.
Small Data Set
Begin with the sheet called “Sample Data” which contains all the data for 21 of 22,000 spots on a tested yeast array. This sheet will familiarize you with the headings and entries you can expect to see when you examine your own data. Some important landmarks are
- Columns C and D give the address for each gene on the array
- Columns J and K list the gene name associated with each spot
- Column L gives some useful information about each gene’s function
Please answer the following questions about this data:
- Where on the array is the spot for the MFA2 gene (column and row)?
- What is the systematic name for SLG1?
- What is the cellular function for SNF2?
- If you would like to look at the yeast genes that are on this array you can consider this question and the next one questions. They are not required! The array annotates FUN11 as “function unknown.” Does this agree with the SGD annotation?
- Where is the PSD1 gene product localized in the cell? does this agree with the SGD annotation for PSD1?
To look at the signal intensities for these 21 spots, you should scroll right. Column AF reports the signal from the green fluorescent molecule Cy3 and Column AG reports the signal from the red fluorescent molecule Cy5. Use the “Format” menu to convert the values in these columns from scientific notation to numbers with no decimal places, and then answer the following questions.
- What are the green and red signal intensities for MFA2?
- What genes give the highest and lowest values in Column AF?
- Are these the same genes that give the highest and lowest values in Column AG?
- What fraction of the listed values have a larger value in Column AF than in Column AG?
- Using the values in Column AF, find the mean and the median value for the three SDC25 signals. What does the agreement of the mean and median tell you about the three values?
- Find the mean and the median for all the values in Column AF and AG. What is the significance that the mean and the median values are not identical? What is the significance that the mean value for Column AF is not identical to the mean value for Column AG?
Larger Data Set
Now you are ready to look at a bigger data set and practice some analytical methods. Look at the second sheet called “Test Array” in the Excel file. This sheet has a subset of the data (9 of the 86 columns) for a subset of the spots (1,500 of the 11,000) from a single microarray experiment.
Some of the data analysis you will perform is
- normalization to correct for the physical and chemical differences in Cy3 and Cy5
- background subtraction to correct for signal intensity in areas of the array that do not have DNA spots, and
- log2 transformations to avoid fractions when expressing signal ratios
Normalization
You will begin by “normalizing” the data. Many normalization methods have been suggested since microarray technology was introduced. We will practice a “global normalization” method that assumes the Cy3 and Cy5 fluorescent intensities differ by a constant factor,
R = kG where R = red (Cy5) and G = green (Cy3)
One way to determine k is to label the same RNA sample with either Cy3 or Cy5 and then compare the mean signal intensities observed on an array. Since microarray experiments are expensive to perform, this direct comparison is not often done. Instead it is assumed that arrays have the same amount of total mRNA for two samples and the difference in overall intensity is k.
- Use the mean signal intensities (data in Columns B and C) from the Test Array to calculate the average intensity for the green and red signals. What is k?
- Now use the median signal intensity (data in Columns D and E) to calculate k. Is there a difference when you calculate k using the mean and the median signal intensities?
Background Correction
Because microarrays are physically small, signal artifacts routinely arise. These artifacts come from tiny droplets with fluorescent molecules that remain on the array, and from scratches on the surface of the slide. Even the light that leaks into some scanners can make parts of the array appear more green or more red. The column headings in your spreadsheet that include “BG” have background measurements and these values can be used to correct the signal intensities for background artifacts.
- Determine the average red and green background signals. Do this for Column F and G (the mean signals) as well as for Column H and I (the median signals).
- Do the differences in the average background signal mirror the differences in the signal itself (Columns B and C vs F and G for example)? Find one green background measurement that is considerably different from the average. Is the red background measurement also different? How could you explain this?
- Insert two new columns after the background signal columns and calculate the “background corrected” values for the green and red signals. These corrected values are determined by subtracting the background measurement for each spot from the signal measurement.
Intensity Ratios
So far you’ve seen that microarray data must be normalized to correct for Cy3 and Cy5 differences as well as “background subtracted” to correct for artifacts on the slide. Recall that microarray experiments are designed to simultaneously compare the expression of many genes in two samples. The corrected intensities can be expressed as a ratio between the corrected signals for the two samples (Green/Red). A ratio of 4 means 4-fold gene induction and a ratio of 0.25 means four-fold repression of that gene.
To avoid the decimals associated with gene repression, the log2 of the ratios is useful. Four-fold induction is reported at log2(4) = the power of 2 needed to get 4 = 2. Four-fold repression is reported as log2(0.25) = the power of 2 needed to get 1/4 = log2(1) – log2(4) = -2. Log2 transformed data makes more sense graphically since a 4-fold induction and a 4-fold repression have the same value but different signs (i.e. +2 and –2).
- Add another column to the Test Array called “Net Green/Red” and calculate the ratio of the background-corrected green signal to the background-corrected red signal. What is the average value for the column?
- Add another column to the Test Array sheet called “Log2 Green/Red” and transform the “Net Green/Red” data to log2 values. What is the average of this column? Draw a histogram that plots these values. Sort the data. Which 5 genes in this data set are most strongly induced and which are most strongly repressed?
Part 3: Hybridize Microarrays
The arrays we will use are the mouse whole genome microarrays from Agilent. Each slide has four arrays, each with 44,000 60-mer oligonucleotides. These “oligos” were first built on glass wafers and then printed onto the slide surface. The oligos represent more than 41,000 mouse genes, many spotted on the slide more than once.
The success of your experiment is absolutely dependent on the following:
- You must hold the slides by the edges only. If you touch the array that is printed on the slide’s surface, you will obscure the DNA that is printed there.
- Each array has a barcode printed on some stickers on one end of each slide. The array is printed on the side of the slide that says “Agilent.” If you try to hybridize your cDNA to the numbered side of the slide, there will be no array there to bind.
To hybridize the arrays

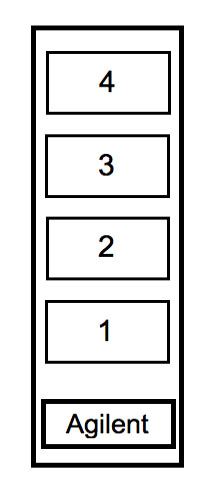
Figure: Layout of Agilent 4x44K whole mouse genome array.
| TEAM COLOR | AGILENT SLIDE |
|---|---|
| Red | Slide 1, array 1 |
| Purple | Slide 1, array 2 |
| Blue | Slide 1, array 3 |
| Pink | Slide 1, array 4 |
| Green | Slide 2, array 1 |
| Yellow | Slide 2, array 2 |
- Begin by mixing the cDNA pools you have synthesized into one eppendorf tube. The total volume should be 57 µl. Add 57 µl of 2X Hybridization Buffer. Pipet up and down several times to mix the contents.
- Heat your hybridization solutions to 80° for 10 minutes then cool them to room temperature. During this time you will be shown how to assemble the hybridization chambers.
- Load your samples into the hybridization chambers as follows:
- open the gasket and place the “Agilent” sticker facing up in the rectangular side of the holder.
- Pipet 110 µl of the hyb solution into place 1, 2, 3 or 4 (see figure) according to the information in the table above.
- Place the microarray “Agilent” sticker down onto the hybridization solution that’s in the gasket.
- Slide on the top portion of the hybridization chamber and the brace.
- Tighten.
When every group is ready, we will walk the arrays over to the BioMicroCenter in Building 68 to put them in the 60°C hybridization oven.
Here’s what will happen tomorrow:
- One of the teaching faculty will wash the unbound cDNAs off your arrays. The wash steps will be 6xSSC/0.005% Triton X-100 at 42° for 10 minutes then 0.2X SSC/0.00016% Triton X-100 at room temperature for 5 minutes.
- The slides will be dried then rehybridized with the Cy3 and Cy5 agents at 65°C for four hours. Genisphere sells these agents as “dendrimers,” essentially large fluorescent balls with an average of 850 fluorophores each. These are described in detail at Genisphere.
During this time, the Cy3 and Cy5 agents will bind the capture sequences on the cDNAs bound to the arrays.
- After 4 hours, the unbound Cy3 and Cy5 agents will be washed off your arrays. The wash steps will be 2X SSC/0.0016% Triton X-100 at 65°C for 10 minutes, 2X SSC/0.0016% Triton X-100 at room temperature for 5 minutes and 0.2X SSC/0.00016% Triton X-100 at room temperature for 10 minutes. The slides will be dried very quickly using Nitrogen gas to blow off any water droplets, then scanned in the Agilent scanner that is available in the BioMicroCenter. The data from your array will be available for you to analyze next time.
DONE!
For Next Time
- Finish your Materials and Methods for your lab report. These will not be collected but doing so now will keep you on track for writing the report that will be due in one week.
Reagents List
- cDNA synthesis cocktail from Genisphere
- Superscript First Strand Buffer
- DTT
- Superase-In
- dNTPs
- Superscript II enzyme
- 2X Hybridization Buffer from Agilent
- 20X SSC from Ambion
- 3M NaCl
- 0.3 M NaCitrate


