cms-631s17.gif
file
440 kB
cms-631s17.gif
Alt text:
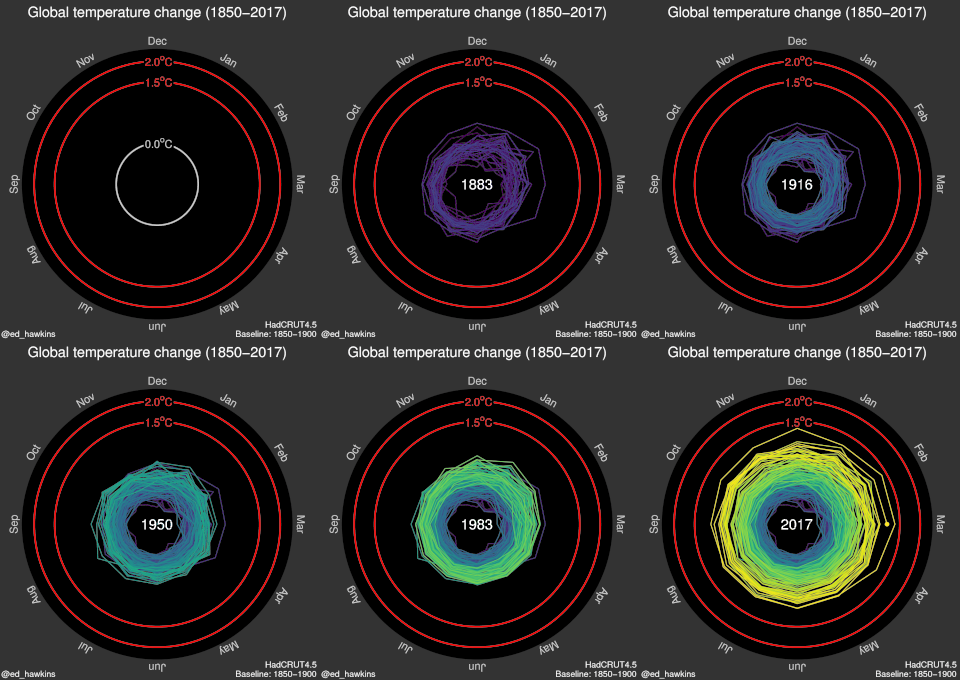
Animated image of multicolored spiral animation showing global average temperature increase.
Caption:
What story does this animated graphic tell about climate change? (Climate Spirals image © Ed Hawkins, License CC BY-SA International 4.0. This content is excluded from our Creative Commons license.)
Credit:
Climate spirals image courtesy of Ed Hawkins.
Course Info
Instructor
As Taught In
Spring
2017
Level
Course Info
Instructor
As Taught In
Spring
2017
Level
Learning Resource Types
Instructor Insights
notes
Lecture Notes