
Gerrymandering New Mexico
In the United States, each state is divided into small regions called districts. In every even-numbered year, the citizens who reside in each district can vote in an election to determine the representative of that district. The representative is a member of the House of Representatives, which is one of the two chambers of the Congress of the United States. Representatives hold great power, as they can propose and vote on bills that later can become laws.
Each representative typically is affiliated with one of the two major political parties in the United States: the Democratic Party or the Republican Party. Each party naturally wants to ensure that they have as many representatives in Congress as possible. One way of achieving this is through gerrymandering.
Gerrymandering refers to the process of redrawing district boundaries so as to favor a particular political party. To illustrate this, suppose we have the hypothetical state below, with three districts. Each district is further subdivided along a grid into smaller subregions, where each subregion votes unanimously for either party. Suppose that in this hypothetical example, there is only one voter in each subregion.
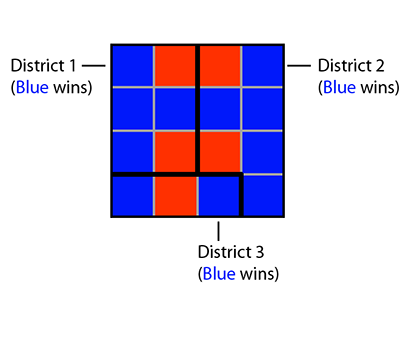
Based on the current district boundaries, the blue party has a majority in each district, so each district elects a blue representative. However, suppose we decide to redraw the boundaries in the following way:
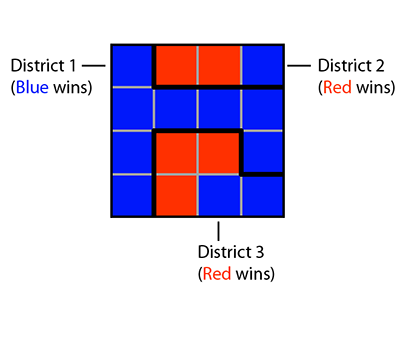
Now the blue party does not win in every district; in fact, the red party wins two of the three districts.
In this problem, we will be exploring how to systematically manipulate these kinds of boundaries. We will be doing this specifically for the state of New Mexico, which is one of the fifty states of the United States.
The Data
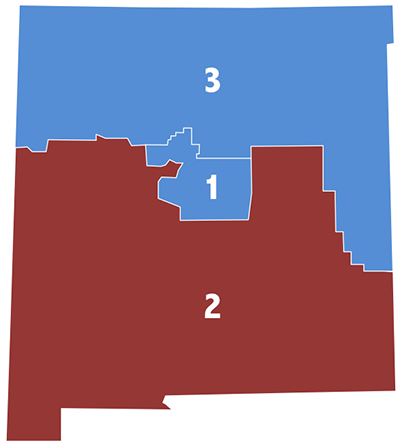
The state of New Mexico, located in the south of the US, currently has three districts:
The state of New Mexico is also divided into counties:
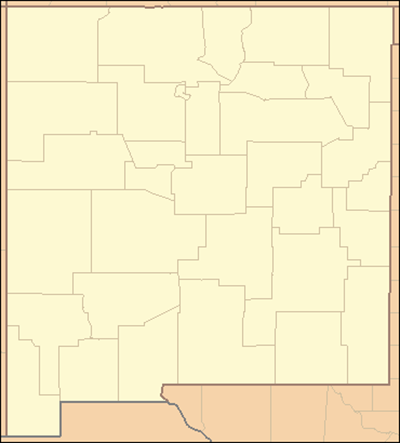
Counties are administrative units that are typically smaller than districts. In many states counties are split across districts, but in this problem we will assume that the new districts we will design will be built from the existing counties.
We have the voting record from the 2012 presidential election for each county in New Mexico. We will use the presidential election voting record of each county in 2012 as a proxy for how the county will vote in the next election for the house of representatives. This data is provided in Gerrymandering (ODS) for LibreOffice and OpenOffice, or Gerrymandering (XLSX) for Excel.
The Problem
In the 2012 House of Representatives election, the Democratic party won in New Mexico’s 1st and 3rd districts, while the Republican party won in the 2nd district.
Suppose that we have the opportunity to gerrymander New Mexico, so that we still have three districts. Is there a way to redesign the three districts so that the Democratic party takes all three districts?
This is the topic of our problem — and we will tackle it using integer optimization. Let’s formulate this problem as follows.
Our principal decision variables are (x_{ij}) defined for each district (i) and each county (j), where (x_{ij}) is 1 if county (j) is assigned to district (i) and 0 otherwise.
The first scenario we will consider is selecting our objective to maximize the number of votes that the Democratic party wins district 2 by (remember that the Democratic party lost in the 2nd district). If we can get the Democratic party to win district 2 by a margin of at least 100 votes while still winning districts 1 and 3 by a margin of at least 100 votes in each district, the Democratic party will win all three districts.
With regard to constraints, we would like:
- Each county to be assigned to exactly one district;
- Each district to consist of at least one county; and
- The Democratic party to still win districts 1 and 3 by a margin of at least 100 votes.
Problem 1.1 - The Objective
Which of the following is the correct objective function for this problem?
O1: maximize ((D_1 - R_1) x_{2,1} + (D_2 - R_2) x_{2,2} + … + (D_{33} - R_{33}) x_{2,33}), where (D_j) and (R_j) are the numbers of Democratic and Republican votes, respectively, cast in county (j)
O2: maximize (x_{1,1} + x_{1,2} + … + x_{1,33} + x_{2,1} + … + x_{2,33} + x_{3,1} + … + x_{3,33})
O3: maximize ((D_1 - R_1) x_{1,1} + (D_2 - R_2) x_{1,2} + … + (D_{33} - R_{33}) x_{1,33}), where (D_j) and (R_j) are the numbers of Democratic and Republican votes, respectively, cast in county (j)
O4: maximize (x_{2,1} + … + x_{2,33})
Problem 1.2 - Assignment Constraints
Which of the following sets of inequalities should we add to our model to capture the constraints that each county should be assigned to exactly one district?
C1: (x_{1,1} + x_{1,2} + … + x_{1,33} + x_{2,1} + … + x_{2,33} + x_{3,1} + … + x_{3,33} = 33)
C2: (x_{1,j} + x_{2,j} + x_{3,j} = 1), for (j = 1, … , 33)
C3: (x_{i,1} + x_{i,2} + … + x_{i,33} \geq 1), for (i = 1, …, 3)
C4: (x_{i,j} = 1,) for (i = 1, …, 3), and (j = 1, …, 33)
Which of the following sets of inequalities should we add to our model to capture the constraints that each district should contain at least one county?
C1: (x_{1,1} + x_{1,2} + … + x_{1,33} + x_{2,1} + … + x_{2,33} + x_{3,1} + … + x_{3,33} = 33)
C2: (x_{1,j} + x_{2,j} + x_{3,j} = 1), for (j = 1, … , 33)
C3: (x_{i,1} + x_{i,2} + … + x_{i,33} \geq 1), for (i = 1, …, 3)
C4: (x_{i,j} = 1,) for (i = 1, …, 3), and (j = 1, …, 33)
Problem 1.3 - District 1 and 3 Constraints
We would also like to ensure that the Democratic Party still wins districts 1 and 3 (with a margin of 100 votes).
Remember that our data gives us for each county the difference (D_i - R_i), where (R_i) is the number of votes cast for the Republican Party, and (D_i) is the number of votes cast for the Democratic Party.
Which of the following is the correct constraint to ensure that the Democratic Party will win district 1 by at least 100 votes?
C1: ((D_1 - R_1) x_{1,1} + (D_2 - R_2) x_{1,2} + … + (D_{33} - R_{33}) x_{1,33} \geq 100)
C2: ((D_1 - R_1) x_{1,1} +(D_2 - R_2) x_{1,2} + … + (D_{33} - R_{33}) x_{1,33} \geq 0)
C3: For each county j, (D_j x_{1,j} - R_j x_{1,j} \geq 100)
We’ll need to add a similar constraint to our model for district 3.
Problem 2.1 - Solving the Problem
Formulate the problem in LibreOffice and solve it. Use the decision variables, the objective and the constraints we defined above. For the vote difference (D_j - R_j), use the numbers given under the column “Scenario 1”.
By how many votes does the Democratic Party win in district 2 under this redistricting?
Problem 2.2 - Adjusting the Objective
Given the data we have provided, it may seem that there are many ways to redistrict the state so that the Democratic Party wins in all three districts. However, some of the new proposals may not be very different from the existing districts, while some may require drastic changes to the boundaries.
In the spreadsheet, we have included information about the current districts, that is, which counties belong to which districts. (Note that this is an approximate assessment because in New Mexico, districts are not exactly made up of counties.)
Let (z_{ij}) be 1 if district i currently contains county j, and 0 otherwise. We wish to ensure that our proposed district assignments and the current district assignments are as “similar” as possible. Which of the following objectives allows us to correctly do this?
O1: maximize ((x_{1,1} - z_{1,1}) + (x_{1,2} - z_{1,2}) + … + (x_{1,33} - z_{1,33}) \+ (x_{2,1} - z_{2,1}) + (x_{2,2} - z_{2,2}) + … + (x_{2,33} - z_{2,33}) \+ (x_{3,1} - z_{3,1}) + (x_{3,2} - z_{3,2}) + … + (x_{3,33} - z_{3,33}))
O2: minimize (z_{1,1} x_{1,1} + z_{1,2} x_{1,2} + … + z_{1,33} x_{1,33} \+ z_{2,1} x_{2,1} + z_{2,2} x_{2,2} + . . . + z_{2,33} x_{2,33} \+ z_{3,1} x_{3,1} + z_{3,2} x_{3,2} + . . . + z_{3,33} x_{3,33})
O3: maximize (z_{1,1} x_{1,1} + z_{1,2} x_{1,2} + … + z_{1,33} x_{1,33} \+ z_{2,1} x_{2,1} + z_{2,2} x_{2,2} + . . . + z_{2,33} x_{2,33} \+ z_{3,1} x_{3,1} + z_{3,2} x_{3,2} + . . . + z_{3,33} x_{3,33})
Problem 2.3 - Re-Solving the Problem
Modify your problem to include the new objective. The old objective should become a constraint like the ones we have for districts 1 and 3 - we want to ensure that the Democratic party wins by a margin of at least 100 votes in district 2 as well.
You should still be using the “Scenario 1” column for the vote differences.
Solve the problem. How many counties are NOT given new assignments (relative to the 2012 districts – columns C through E in the spreadsheet) in this new solution?
Problem 2.4 - Understanding the Solution
Which counties have been re-assigned relative to the 2012 assignments (columns C through E in the spreadsheet)? Select all that apply.
1 - Bernalillo
2 - Catron
3 - Chaves
4 - Cibola
5 - Colfax
6 - Curry
7 - DeBaca
8 - Dona Ana
9 - Eddy
10 - Grant
¨C36C11 - Guadalupe
¨C37C12 - Harding
¨C38C13 - Hidalgo
¨C39C14 - Lea
¨C40C15 - Lincoln
¨C41C16 - Los Alamos
¨C42C17 - Luna
¨C43C18 - McKinley
¨C44C19 - Mora
¨C45C20 - Otero
¨C46C21 - Quay
¨C47C22 - Rio Arriba
¨C48C23 - Roosevelt
¨C49C24 - Sandoval
¨C50C25 - San Juan
¨C51C26 - San Miguel
¨C52C27 - Santa Fe
¨C53C28 - Sierra
¨C54C29 - Socorro
¨C55C30 - Taos
¨C56C31 - Torrance
¨C57C32 - Union
¨C58C33 - Valencia
In addition to ensuring that the Democratic Party wins in each district, we also may have to take into account other considerations:
- Exactly one of Santa Fe (county 27) or Dona Ana (county 8) must be in district 2.
- Both Socorro (county 29) and Torrance (county 31) must be in the same district.
Problem 3.1 - A New Constraint
Which of the following constraints models constraint 1 listed above?
C1: (x_{2,27} + x_{2,8} \leq 1)
C2: (x_{2,27} + x_{2,8} = 1)
C3: (x_{2,27} + x_{2,8} = 2)
Problem 3.2 - A New Constraint
Which of the following models constraint 2 listed above?
C1: (x_{1,29} + x_{2,29} + x_{3,29} = x_{1,31} + x_{2,31} + x_{3,31})
C2: (x_{1,29} + 2 x_{2,29} + 3 x_{3,29} = x_{1,31} + 2 x_{2,31} + 3 x_{3,31})
C3: (x_{1,29} = x_{1,31})
This constraint cannot be modeled using the variables of our model.
Problem 3.3 - Re-Solving the Problem
Add these two constraints and re-solve the problem. How many counties have been re-assigned (relative to the 2012 assignments in columns C through E of the spreadsheet)?
Problem 3.4 - Re-Assigned Counties
Which counties have been re-assigned relative to the 2012 assignments (columns C through E in the spreadsheet)? Select all that apply.
1 - Bernalillo
2 - Catron
3 - Chaves
4 - Cibola
5 - Colfax
6 - Curry
7 - DeBaca
8 - Dona Ana
9 - Eddy
10 - Grant
¨C79C11 - Guadalupe
¨C80C12 - Harding
¨C81C13 - Hidalgo
¨C82C14 - Lea
¨C83C15 - Lincoln
¨C84C16 - Los Alamos
¨C85C17 - Luna
¨C86C18 - McKinley
¨C87C19 - Mora
¨C88C20 - Otero
¨C89C21 - Quay
¨C90C22 - Rio Arriba
¨C91C23 - Roosevelt
¨C92C24 - Sandoval
¨C93C25 - San Juan
¨C94C26 - San Miguel
¨C95C27 - Santa Fe
¨C96C28 - Sierra
¨C97C29 - Socorro
¨C98C30 - Taos
¨C99C31 - Torrance
¨C100C32 - Union
¨C101C33 - Valencia
Problem 4.1 - Voting Considerations
So far, we have been using only one voting scenario to design our districts. In this scenario, we’ve assumed that each county will vote in the representative election of its designated district the same way it voted in the 2012 presidential election (scenario 1 in the spreadsheet). For example, Bernalillo county will vote for the Democratic candidate of its district, with a margin of 42,941 more voters (i.e., the number of Democratic votes from Bernalillo is 42,941 higher than the number of Republican votes).
This is a problematic feature of the model, because voters will not vote in this exact way in future elections. In fact, if they vote sufficiently differently, the democratic party may not be able to win all of its representative elections.
To illustrate this, consider the margins under “Scenario 2” in the spreadsheet. Use these values in place of the original margins to compute how many votes more than the Republican party the Democratic Party gets in the districts, given the optimal solution from Problem 11. Which districts does the Democratic Party lose? Select all that apply.
District 1
District 2
District 3
Problem 4.2 - Voting Scenarios
Let’s change our formulation to make it more robust to changes in voter behavior. Suppose that in addition to the data we have been using so far (based on the 2012 presidential election numbers), we also wish to account for two other scenarios: scenario 2 (which we just used in Problem 12) and scenario 3. These scenarios are based on forecasts obtained from a separate prediction model. Furthermore, we want to make sure that the Democratic party wins by a large margin, so we will change the constraints to ensure that the Democratic party wins at least 12,000 more votes than the republicans.
To do this, we need to revisit our constraints that ensure that the Democratic party wins each district. In particular, the Democratic Party should win each district with a margin of at least 12,000 votes in every scenario; so instead of three constraints (one for each district), we should have nine constraints (one for each district and scenario pair).
Add these constraints to the model, and re-solve it. How many counties have been re-assigned relative to the existing 2012 assignments (columns C through E in the spreadsheet)?
Problem 4.3 - Understanding the New Solution
Which counties have been re-assigned? Select all that apply.
1 - Bernalillo
2 - Catron
3 - Chaves
4 - Cibola
5 - Colfax
6 - Curry
7 - DeBaca
8 - Dona Ana
9 - Eddy
10 - Grant
¨C118C11 - Guadalupe
¨C119C12 - Harding
¨C120C13 - Hidalgo
¨C121C14 - Lea
¨C122C15 - Lincoln
¨C123C16 - Los Alamos
¨C124C17 - Luna
¨C125C18 - McKinley
¨C126C19 - Mora
¨C127C20 - Otero
¨C128C21 - Quay
¨C129C22 - Rio Arriba
¨C130C23 - Roosevelt
¨C131C24 - Sandoval
¨C132C25 - San Juan
¨C133C26 - San Miguel
¨C134C27 - Santa Fe
¨C135C28 - Sierra
¨C136C29 - Socorro
¨C137C30 - Taos
¨C138C31 - Torrance
¨C139C32 - Union
¨C140C33 - Valencia
Problem 4.4 - Margin of Victory
By what margin does the Democratic Party win in district 3 in Scenario 2?
By what margin does the Democratic Party win in district 1 in Scenario 3?


