
Video 4: Basic Scatterplots Using ggplot
In the rest of this lecture, we’ll be using the data file WHO (CSV). Please download this file to your computer, and save it to a location that you will remember. This data comes from the Global Health Observatory Data Repository.
An R script file with all of the commands used in this lecture can be downloaded here: Resource Unit7_WHO (R).
Colors and shapes in R
If you want to see all of the available colors in R, type in your R console:
colors()
All of the available shapes are described in the following image:
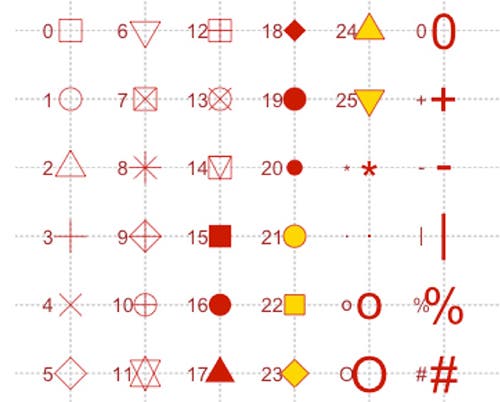
This image comes from Cookbook for R. License: CC BY-SA. This content is excluded from our Creative Commons license. For more information, see https://ocw.mit.edu/help/faq-fair-use/.
The number 0 corresponds to an empty square, the number 6 corresponds to an upside down triangle, etc.


