
3.2 Modeling the Expert: An Introduction to Logistic Regression
ROC-Thresholds.png
Description:
Image:
file
54 kB
ROC-Thresholds.png
Alt text:
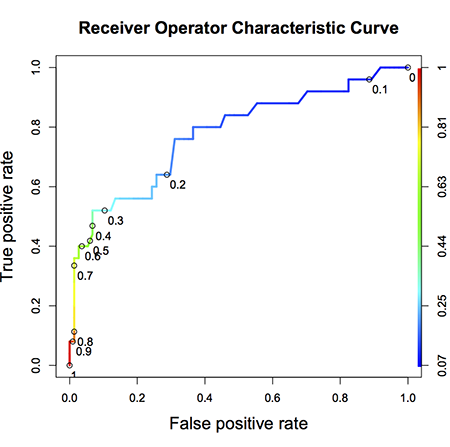
Plot of receiver operator characteristic curve false vs. true positive rates.
Course Info
Instructor
Departments
As Taught In
Spring
2017
Level
Learning Resource Types
notes
Lecture Notes
theaters
Lecture Videos
assignment_turned_in
Problem Set Solutions
assignment
Problem Sets


