
7.2 Visualizing the World: An Introduction to Visualization
Scatterplot_Week7.jpg
Description:
Image:
file
50 kB
Scatterplot_Week7.jpg
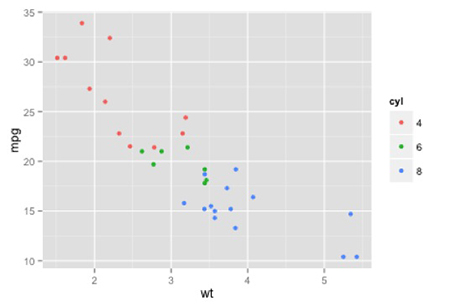
Alt text:
Scatterplot showing the miles per gallon of a car as a function of the car's weight.
Course Info
Instructor
Departments
As Taught In
Spring
2017
Level
Learning Resource Types
notes
Lecture Notes
theaters
Lecture Videos
assignment_turned_in
Problem Set Solutions
assignment
Problem Sets


