
7.2 Visualizing the World: An Introduction to Visualization
USmap_Week7.jpg
Description:
Image:
file
122 kB
USmap_Week7.jpg
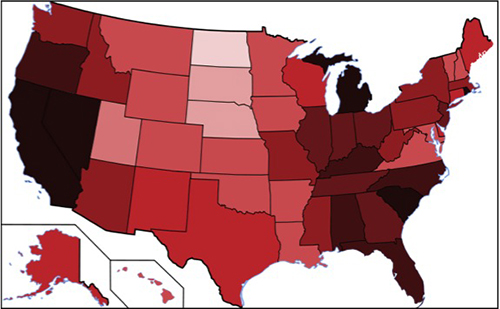
Alt text:
U.S. state map indicating unemployment by state by varying shades of red.
Course Info
Instructor
Departments
As Taught In
Spring
2017
Level
Learning Resource Types
notes
Lecture Notes
theaters
Lecture Videos
assignment_turned_in
Problem Set Solutions
assignment
Problem Sets


