7.3 The Analytical Policeman: Visualization for Law and Order
Week7_Crime_QQ4_1.png
Description:
Image:
file
44 kB
Week7_Crime_QQ4_1.png
Alt text:
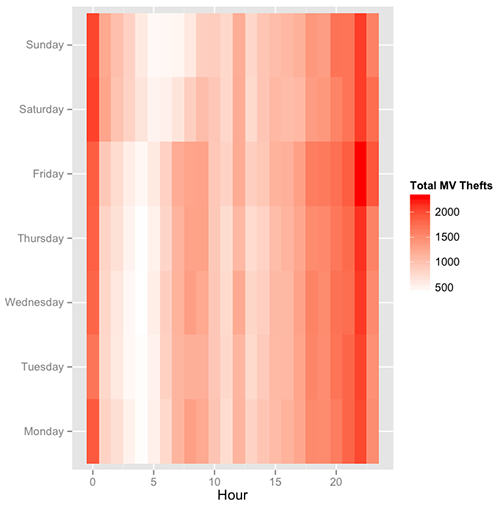
Heatmap of total motor vehicle thefts according to time and day in shades of red.

Course Info
Instructor
Departments
As Taught In
Spring
2017
Level
Learning Resource Types
theaters
Lecture Videos
notes
Lecture Notes
assignment_turned_in
Problem Sets with Solutions


