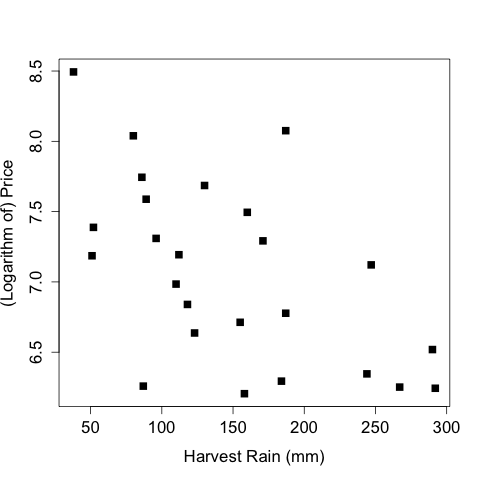
2.2 The Statistical Sommelier: An Introduction to Linear Regression
Wine_QQ1_Plot2.png
Course Info
Instructor
Departments
As Taught In
Spring
2017
Level
Learning Resource Types
theaters
Lecture Videos
notes
Lecture Notes
assignment_turned_in
Problem Sets with Solutions


